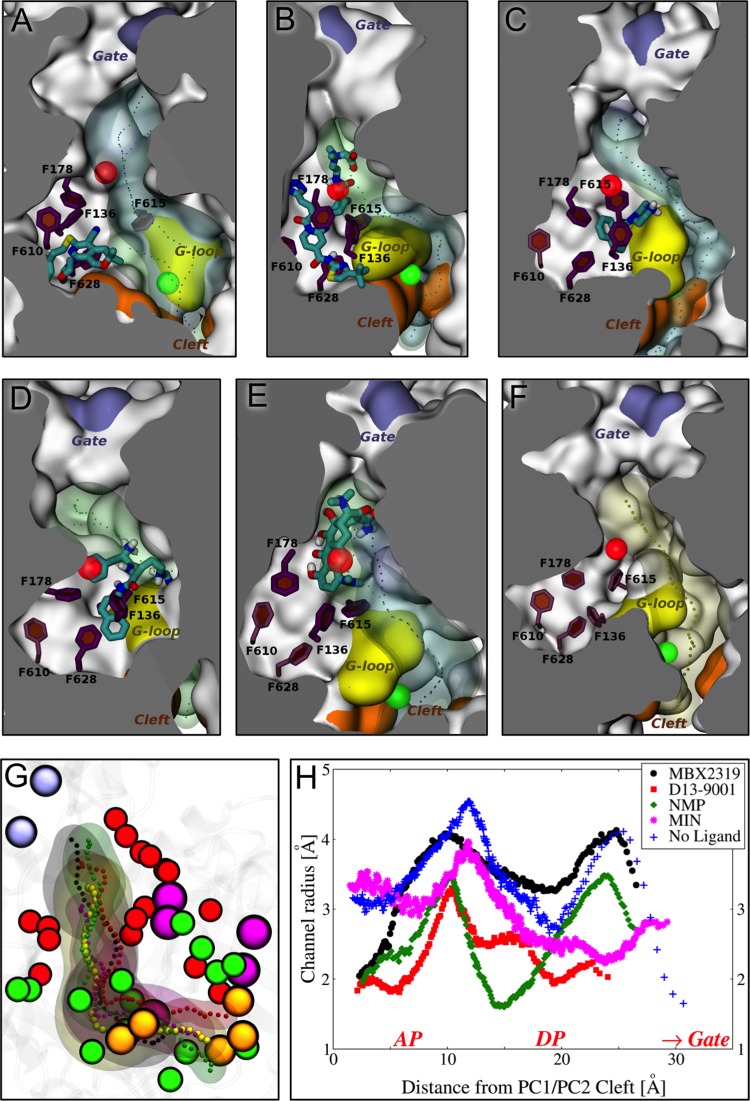
FIG 4.
(A to E) Positions of the various ligands used in this study with respect to the hydrophobic trap in protomer B of AcrB, as found in representative average structures of the complexes from MD simulations. The ligands are shown in thick sticks colored according to the atom type (red, oxygen; yellow, sulfur; dark blue, nitrogen; cyan, carbon; white, hydrogen), and the side chains of the residues constituting the hydrophobic trap are shown with sticks (thick if the residue is within 3.5 Å of the ligand, thinner otherwise). The rest of the protein is shown with the molecular surface colored in orange, yellow, and ice blue at the PC1/PC2 cleft, the G-loop tip, and the exit gate, respectively, and white elsewhere. The channels leading to the proximity of the exit gate (see Fig. 1) and passing through the residues of the DP are also shown in the presence and absence of the ligand, with blue and green transparent surfaces, respectively, while the centers of gravity of the points defining them are shown with points. The centers of mass of the AP and DP are shown with green and red transparent spheres, respectively. No contiguous substrate translocation channel was found in the AcrB-PAβN complex (and also in AcrBF610A-DOX [see Fig. S2 in the supplemental material]). (A to E) MBX2319 (A), D13-9001 (B), NMP (C), PAβN (D), and MIN(E). (F) Channel found in AcrB free of ligands, again as found in the representative average structure of the transporter. (G) Superposition among the channels in panels A (black), B (red), C (green), E (magenta), and F (yellow). C-α atoms of the cleft, exit gate, and distal and access pockets are shown with orange, ice blue, red, and green beads, respectively. (H) Profile radii of the channels calculated in the presence of the ligands and shown in panel G. The positions of DP, AP, cleft, and gate on the x axis are approximate.

