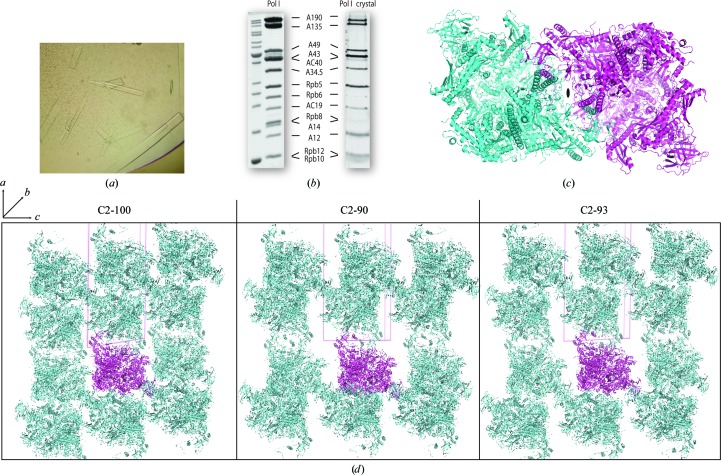
Figure 1.
Crystallization of Pol I. (a) Typical Pol I crystals in space group C2 grown in sitting drops, as imaged 5 d after experimental setup. (b) 15% SDS–PAGE analysis of purified yeast Pol I (Coomassie staining) and a Pol I crystal (silver staining). The different relative intensity of the bands is owing to the different staining methods. Thicker bands of the MW marker (left lane) correspond to 50 and 10 kDa. (c) Pol I dimer formed by insertion of the A43 C-terminal tail of one monomer (pink) into the upper cleft of the neighbouring monomer (cyan) and vice versa. (d) Crystal packing in the different crystal forms as viewed from the b axis.

