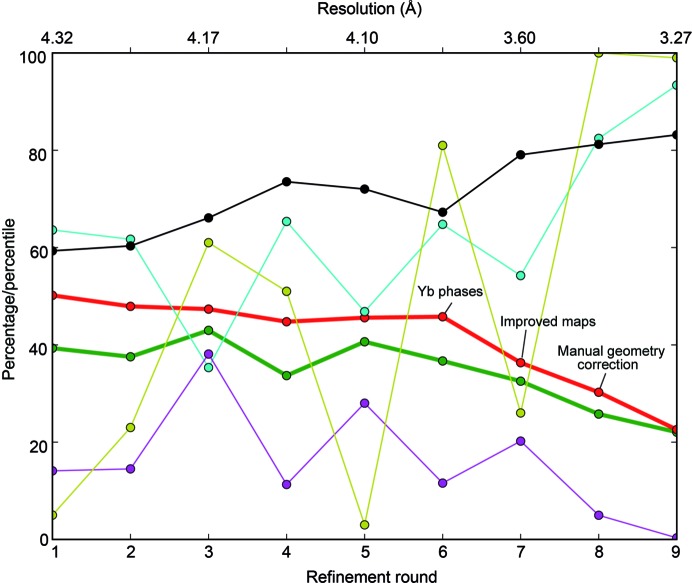
Figure 4.
Evolution of structural refinement in C2-93. R work (green), R free (red), Ramachandran favoured residues (blue), Ramachandran outliers (purple), MolProbity percentile (yellow) and residues built (black), all expressed in percentages, are plotted per refinement cycle. Rounds 1–6 were run against native 1 at increasing resolution cutoffs, while rounds 7–9 were run against native 2 using the same strategy (Table 2 ▶).

