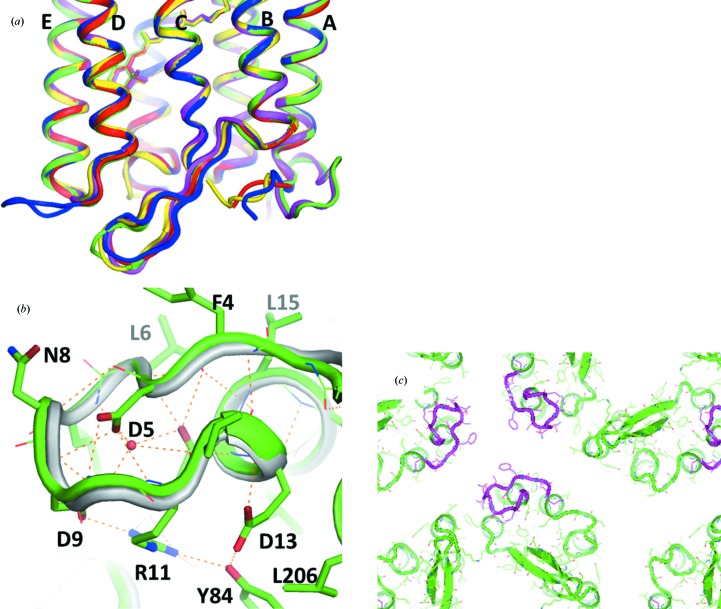
Figure 8.
(a) Structural comparison of aR2 in the H32 crystal (green), bR in the P622 crystal (orange; PDB entry 1iw6; Matsui et al., 2002 ▶), cR3 in the P321 crystal (blue; PDB entry 4jr8; Chan et al., 2014 ▶) and dR3 in the R32 crystal (yellow; PDB entry 4fbz; Zhang et al., 2013 ▶). (b) The N-terminal region of aR2 in the H32 crystal (green) is compared with that of aR1 in the P43212 crystal (grey; PDB entry 1uaz; Enami et al., 2003 ▶). (c) The outline of the inter-trimer space in the hexagonal lattice found in the H32 crystal of aR2, viewed from the extracellular side. The N-terminal region of aR2 is shown in magenta.

