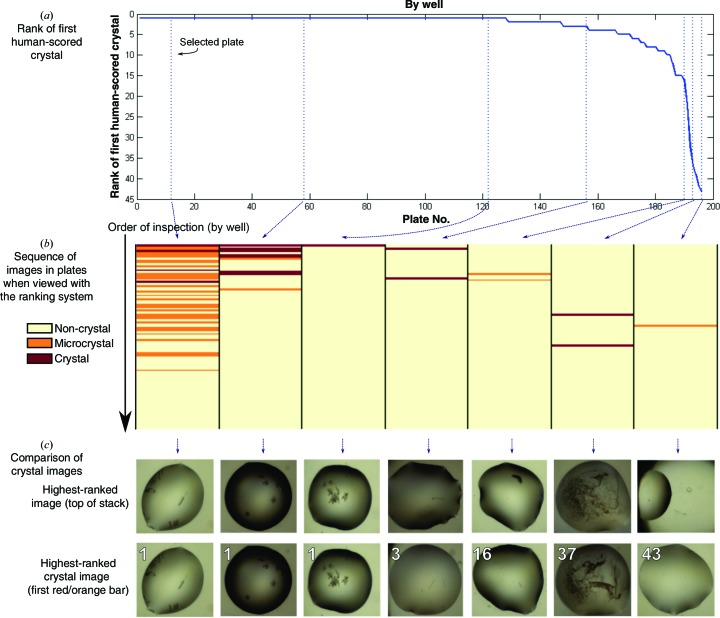
Figure 11.
Effectiveness of the algorithm at ranking crystal-containing images. (a) Rank of first human-scored crystal image in the plate. The ideal curve is a horizontal line with y axis = 1 if all plates have been well ranked. (b) Enrichment plot for the representative plates marked by the dotted lines in (a). Each column represents a plate with the wells as horizontal lines coloured for clear crystals (red), microcrystals (orange) and ‘uninteresting’ droplets (yellow), as scored by a crystallographer; it is clear that ‘interesting’ images are effectively being moved to the top of the viewing order. A similar plot for all plates used can be found in Supplementary Fig. S3. (c) Actual images for the plates shown in (b), showing the inherent problems in those drops which the algorithm failed to rank highly (the last three).

