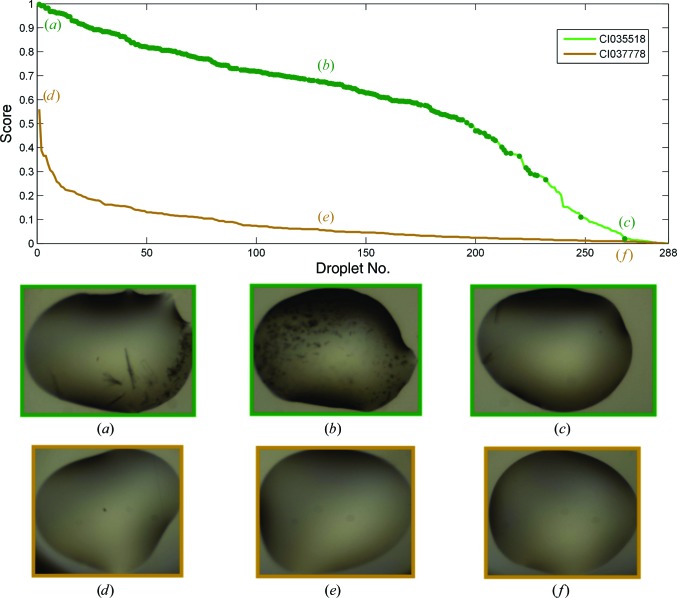
Figure 14.
Comparison of scores of droplets in two plates. The scores are the posterior probability of a droplet being ‘interesting’ and the profile of the curve gives an overview of a plate. Plate CI035518 (green) was an optimization screen, in which 213 droplets contained crystals or microcrystals, marked with dark green dots on the curve. It thus received generally higher scores. In contrast, CI037778 (brown) contained no crystals and contained mainly clear drops. The scores for this plate tailed off rapidly. The highest scored image here was a droplet with dust speckles. The embedded images are the corresponding droplets that that were ranked 1, 100 and 268.

