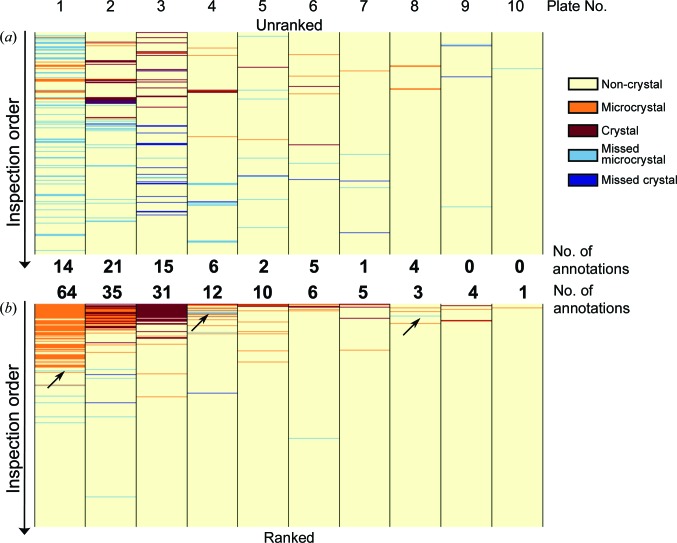
Figure 15.
Comparison of annotations between two groups of crystallographers. Each column represents a plate of 288 droplets inspected in the unranked order (a) and ranked order (b), and the rows are coloured according to the majority vote for these images: yellow, non-crystals; orange, microcrystals; red, mountable crystals. Blue rows indicate missed (micro)crystals, where the corresponding images were annotated in one viewing order but not the other. The total numbers of annotations (orange and red rows) are shown in between. The black arrows show the location of missed (micro)crystals in the ranked order.

