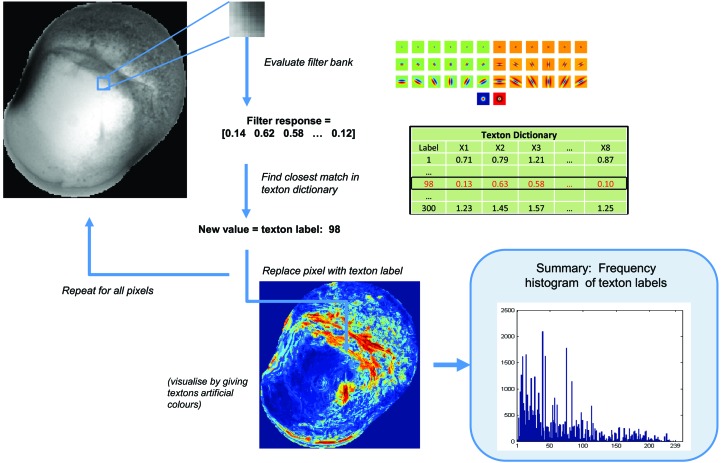
Figure 4.
Calculating the texton distribution from an image. Given a new image, each pixel is filtered with the filter bank and its filter response is compared with the texton dictionary generated previously. The label of the closest match in the dictionary is used to label the pixel. The final feature vector for each image is the frequency histogram of all texton labels in the dictionary.

