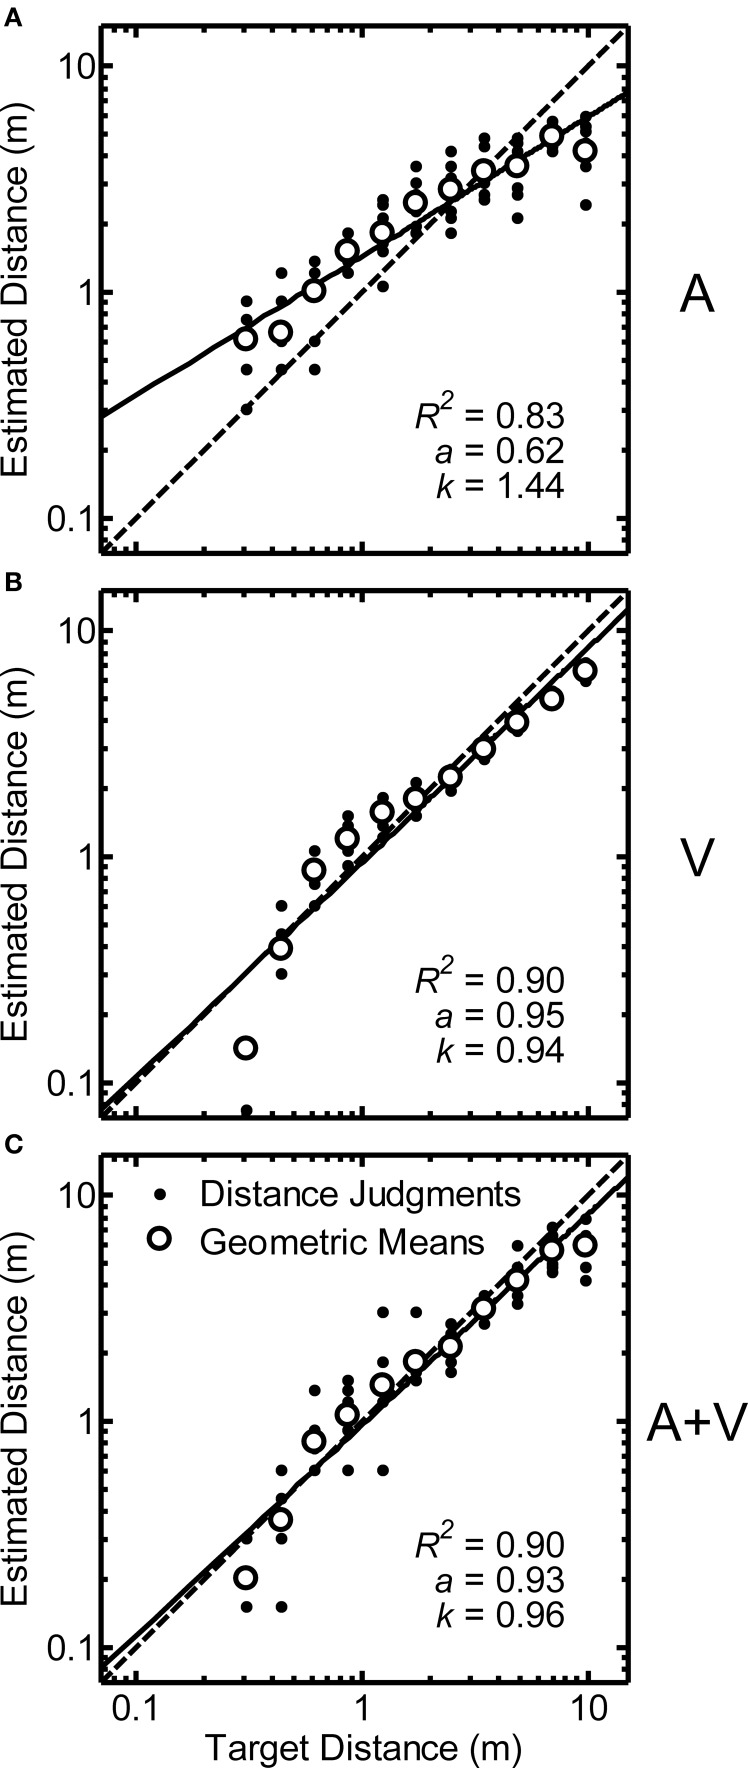
Figure 2.
Data from a single representative participant (code QAD) for auditory (“A,” panel A), visual (“V,” panel B), and auditory/visual (“A+V,” panel C) conditions plotted on logarithmic axes. Dots show raw distance judgments (y): 10 replications/distance. Open circles indicate geometric means (y) for each target distance. Data from each condition were fit with a power function (ŷ; solid line) of the form ŷr = kΦar (ŷr = perceived distance, k = constant, a = power-law exponent, Φr = target source distance). Fit parameters and the proportion of variability accounted for by the fit (R2) are shown in each panel. Perfectly accurate performance is indicated by the dotted line in each panel.

