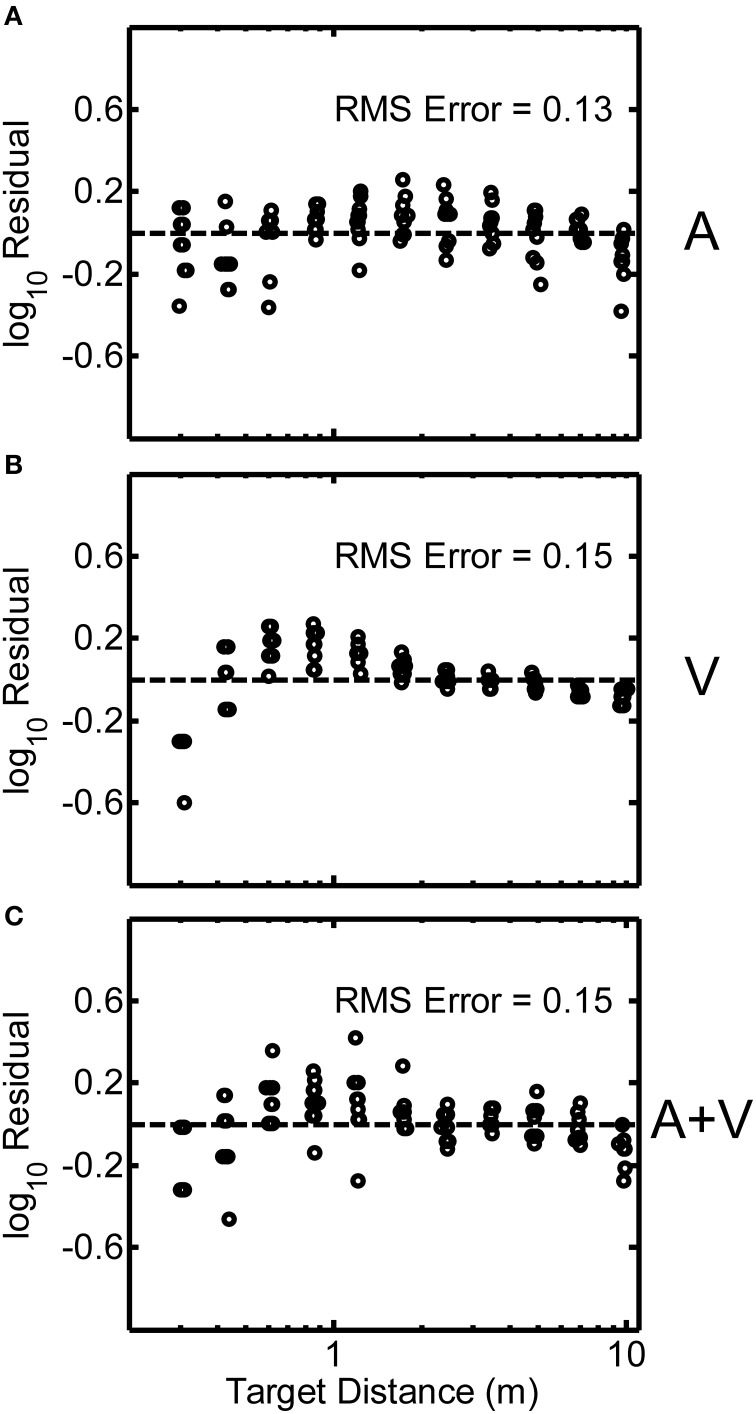
Figure 6.
Log-transformed residuals from the power function fit for a single representative participant (code QAD, see Figure 2) for the A (A), V (B), and A+V (C) conditions. RMS error across all distances is indicated in each panel. Small random jitter was added to the target distances on the x-axis for visualization purposes.

