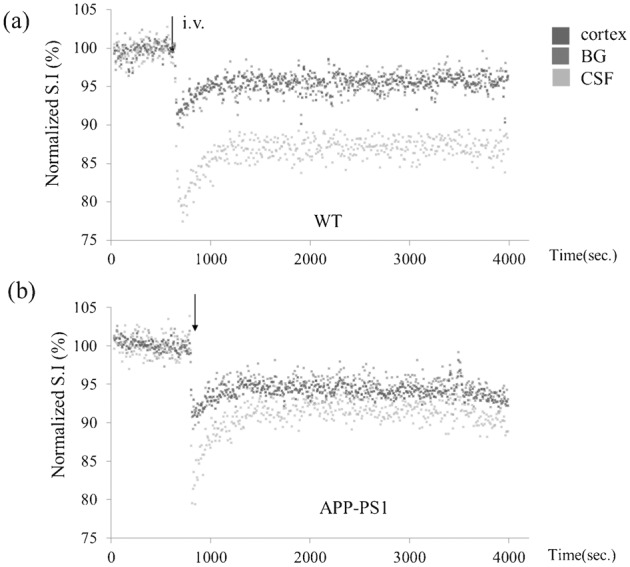
Figure 3.

Representative time course. Representative time course of signal intensities within pixels of each region of interest (ROI) shown in Fig. 1 following intravenous H217O administration in transgenic (APP-PS1) and age-matched wild-type (WT) mice. Blue: cortex, red: basal ganglia (BG), green: cerebrospinal fluid (CSF) within the third ventricle. Each dot represents the intensity of each pixel within the ROI.
