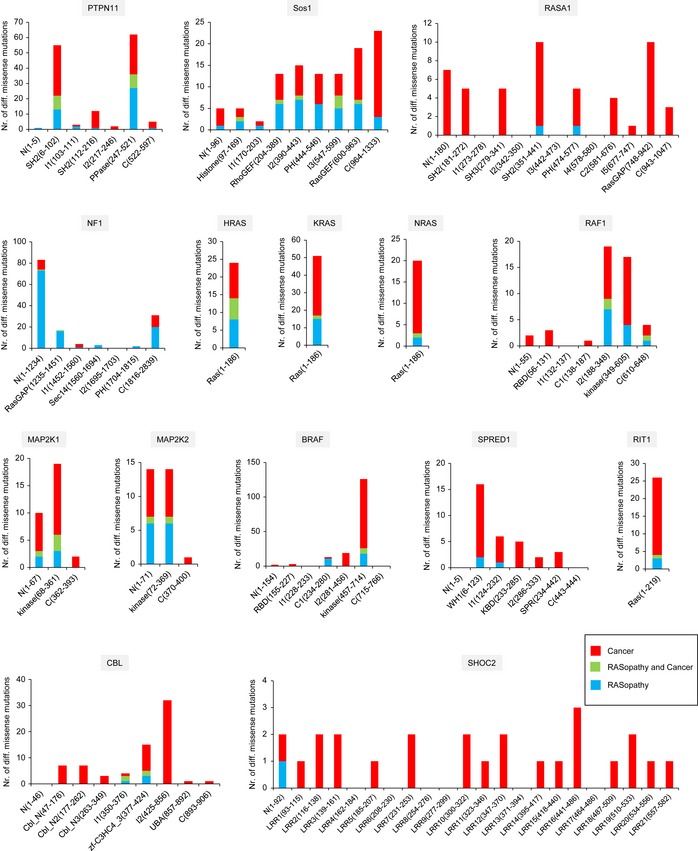
Figure 2. Distribution of somatic and germline mutations in 98 different structural domains and inter‐structural regions.

For each gene, the number of different missense mutations were mapped on the respective domains and inter‐structural regions (called I1 to Ix, and ‘N’ = N‐terminal region; ‘C’ = C ‐terminal region). The colour of the bar diagrams represent mutations from different classes (see legend).
