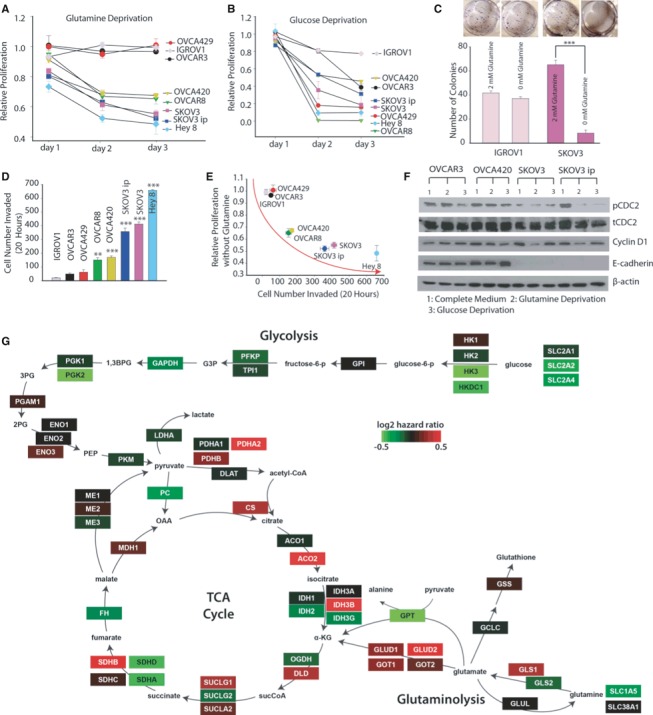
Figure 1. Glutamine addiction and cancer invasiveness are positively correlated in ovarian cancer cells (OVCA).

- Gln deprivation effect on proliferation rate of a panel of OVCA cells for 24, 48 and 72 h. OVCAR3, IGROV1, OVCA429 cells were Gln independent; OVCA420 and OVCAR8 cells were moderately Gln dependent; and SKOV3, SKOV3ip and Hey 8 cells were Gln dependent. n ≥ 15.
- Glucose deprivation effect on proliferation rate of OVCA cell lines for 24, 48, 72 h. n ≥ 15.
- Gln deprivation effect on clonogenic formation in IGROV1 and SKOV3. n = 6.
- Matrigel invasion assay was conducted to characterize invasiveness of OVCA cell lines. OVCAR3, IGROV1 and OVCA429 cells were noninvasive, OVCA420 and OVCAR8 cells were moderately invasive, while SKOV3, SKOV3ip and Hey 8 were highly invasive OVCA cell lines. n ≥ 6.
- Correlation between proliferation rate at 72 h of OVCA cell lines under Gln‐depleted conditions with their corresponding number of invaded cells.
- Western blot analysis of cell cycle proteins linked with growth rate (CDC2, Cyclin D1) and protein linked with metastatic potential (E‐cadherin) in OVCA cell lines. β‐actin was used as the loading control.
- Genes in the glutaminolysis and tricarboxylic acid cycle metabolic pathways are associated with higher risk in OVCA patients. Shown is a metabolic network and the genes (rectangles) that produce the enzyme catalyzing the reactions in the network. The genes in the network are colored by their correlation with OVCA patient survival based on calculating their Cox hazard values (color key). The gene expression and clinical data were fitted with a Cox proportional hazard model to determine the hazard ratio for each gene in Gln/glucose metabolic network. A higher hazard ratio (poor outcome) was observed in gene products that catalyze reactions in Gln catabolism and higher expression of glycolytic genes culminated in better patient survival (low hazard ratio).
Data information: Data in (A–D) are expressed as mean ± SEM, *P < 0.05, **P < 0.01, ***P < 0.001. In (D), 1‐way ANOVA with Tukey's test was used to compare between cell lines, using OVCAR3 as the control.
