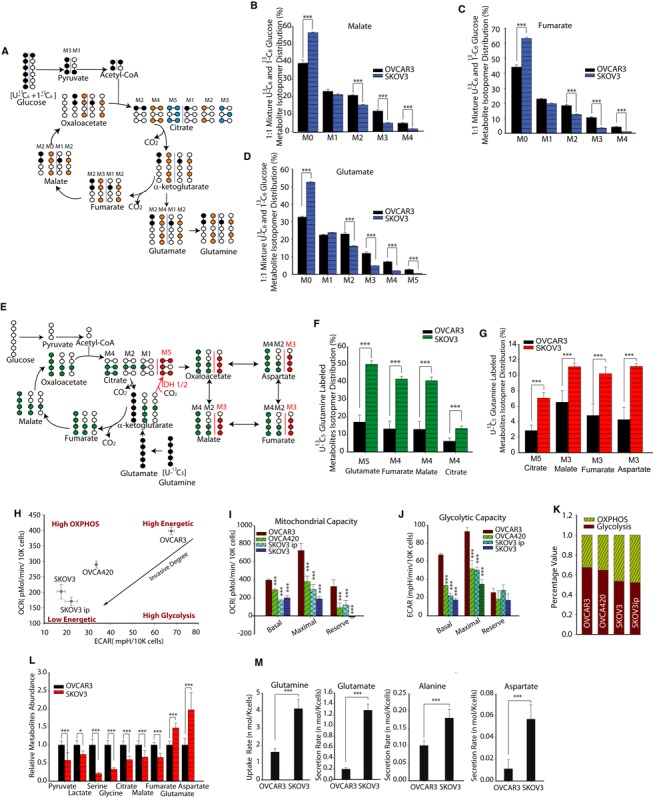
Figure 2. Glutamine‐driven tricarboxylic acid (TCA) cycle metabolite abundances, reductive carboxylation and oxidative phosphorylation are significantly higher in high‐invasive than in low‐invasive ovarian cancer (OVCA) cells.

-
ASchematic of carbon atom transitions using 1:1 mixture of 13C6 glucose and 1‐13C‐labeled glucose. This allows estimations of the contribution of glucose toward TCA cycle metabolites and synthesis of glutamate and Gln. Black color represents labeled carbon on 1st TCA cycle, yellow color represents labeled carbon on 2nd TCA cycle, and blue color represents labeled carbon on 3rd TCA cycle.
-
B–DGlucose's contribution to TCA metabolites and glutamate pool. Comparison of mass isotopomer distribution (MID) of malate (B), fumarate (C), glutamate (D) in high‐invasive (SKOV3) and low‐invasive (OVCAR3) cells cultured with a 1:1 mixture of 13C6 glucose and 1‐13C‐labeled glucose.
-
ESchematic of carbon atom transitions using 13C5‐labeled Gln. Black color represents labeled carbon of Gln before its entry into TCA cycle. Green color represents Gln's direct effect on canonical TCA cycle, red color represents Gln's effect on TCA cycle through reductive carboxylation.
-
FGln's contribution to TCA cycle metabolites pool. Comparisons of MID of M5 glutamate, M4 fumarate, M4 malate, M4 citrate in OVCAR3 and SKOV3 cultured with 13C5‐labeled Gln.
-
GMass isotopomer analysis of isotopomers linked with reductive carboxylation. M5 citrate, M3 malate, M3 fumarate and M3 aspartate analysis indicates significantly higher reductive carboxylation fluxes in high‐invasive than in low‐invasive OVCA cells.
-
HBasal oxygen consumption rate (OCR) and extracellular acidification rate (ECAR) were measured for OVCAR3, OVCA420, SKOV3 and SKOV3ip cell lines. Basal OCR is a measure of OXPHOS activity, and basal ECAR is a measure of glycolysis activity.
-
IUsing oligomycin, FCCP and antimycin, we estimated mitochondrial functional state in OVCA cells through maximal and reserve mitochondrial capacities.
-
JUsing 2DG, we estimated glycolytic functional state in OVCA cells through maximal and reserve glycolytic capacities.
-
KPercentage of OXPHOS and glycolysis contribution to cancer cell's energetic demand.
-
LRelative metabolite abundances were measured using GC‐MS in OVCAR3 and SKOV3 cells.
-
MExtracellular uptake/secretion fluxes of amino acids involved in glutaminolysis (Glutamine: Gln; Glutamate: Glu; Alanine: Ala; Aspartate: Asp) were measured using ultra‐high‐performance liquid chromatography.
Data information: Data are expressed as mean ± SEM, n ≥ 9, *P < 0.05, **P < 0.01, ***P < 0.001. In (I) and (J), one‐way ANOVA with Tukey's test was used to compare between cell lines, using OVCAR3 as the control.
