
Figure 3. Genetic regulation of metabolite variation.
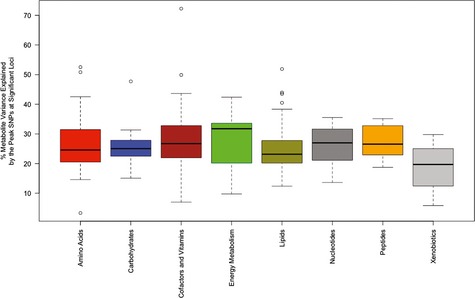
Comparison of percent metabolite variance explained by the peak maker in the GWAS analysis across various classes of metabolites. The largest variance explained was observed for the Vitamins and Cofactors class with the peak marker explaining 72% of the pyridoxate variation.