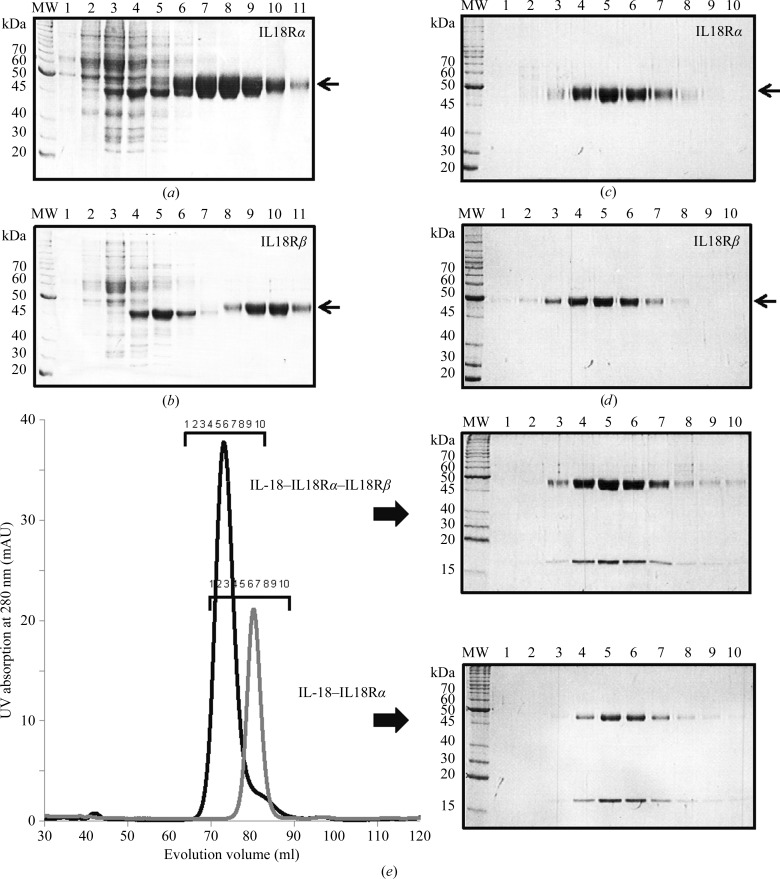
Figure 1.
SDS–PAGE analysis of each purification stage. Elution fractions of (a) IL-18Rα and (b) IL-18Rβ from an Ni–NTA agarose column with an imidazole linear gradient. Peak fractions of (c) IL-18Rα and (d) IL-18Rβ on size-exclusion chromatography. (e) Elution profiles of the IL-18 binary (gray) and IL-18 ternary (black) complexes on size-exclusion chromatography; the peak fractions were analyzed by SDS–PAGE.

