Figure 2.
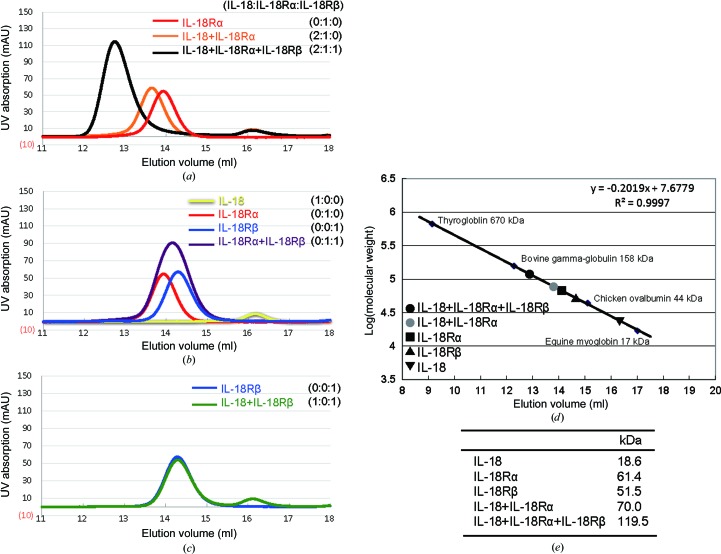
Gel-filtration profiles for recombinant IL-18, IL-18Rα and IL-18Rβ and their mixtures in all possible combinations. IL-18 and its receptors were mixed at the ratios indicated. (a) The typical trace for the binary IL-18–IL-18Rα complex (orange) and ternary IL-18–IL-18Rα–IL-18Rβ complex (black). (b) The elution profile for a 1:1 mixture of IL-18Rα and IL-18Rβ (purple) overlaid with that for each receptor alone (red or blue). (c) The IL-18 and IL-18Rβ mixture (green) eluted in two separated peaks. (d) The elution volumes for IL-18, IL-18Rα, IL-18Rβ and its complexes were plotted against the calibration line. (e) A summary of the deduced molecular weights.

