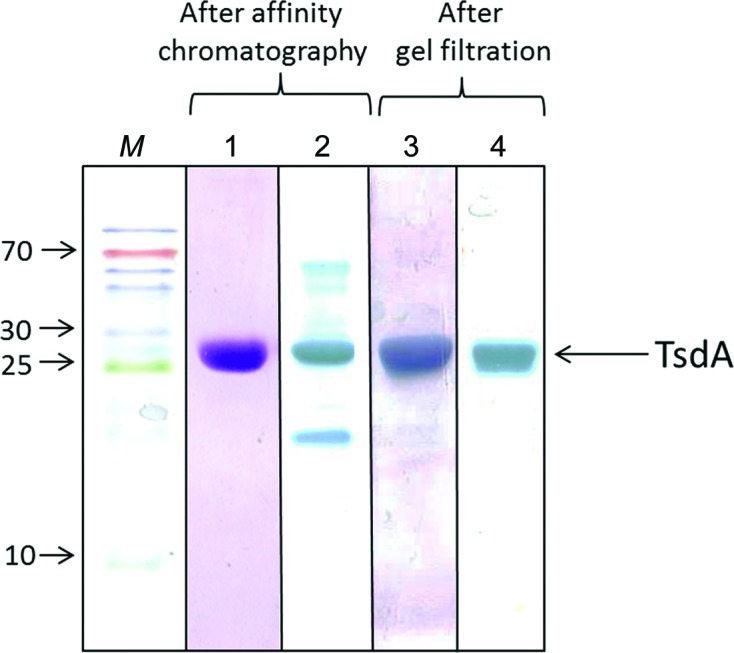
Figure 1.

Coomassie (lanes 1 and 3) and haem (lanes 2 and 4) staining of SDS–PAGE gels. TsdA preparations obtained after affinity chromatography (lanes 1 and 2) and after gel filtration (lanes 3 and 4) were analyzed. Protein loaded per lane: 3.5 µg in lanes 1 and 2, and 5 µg in lanes 3 and 4. Lane M contains molecular-mass markers (labelled in kDa).
