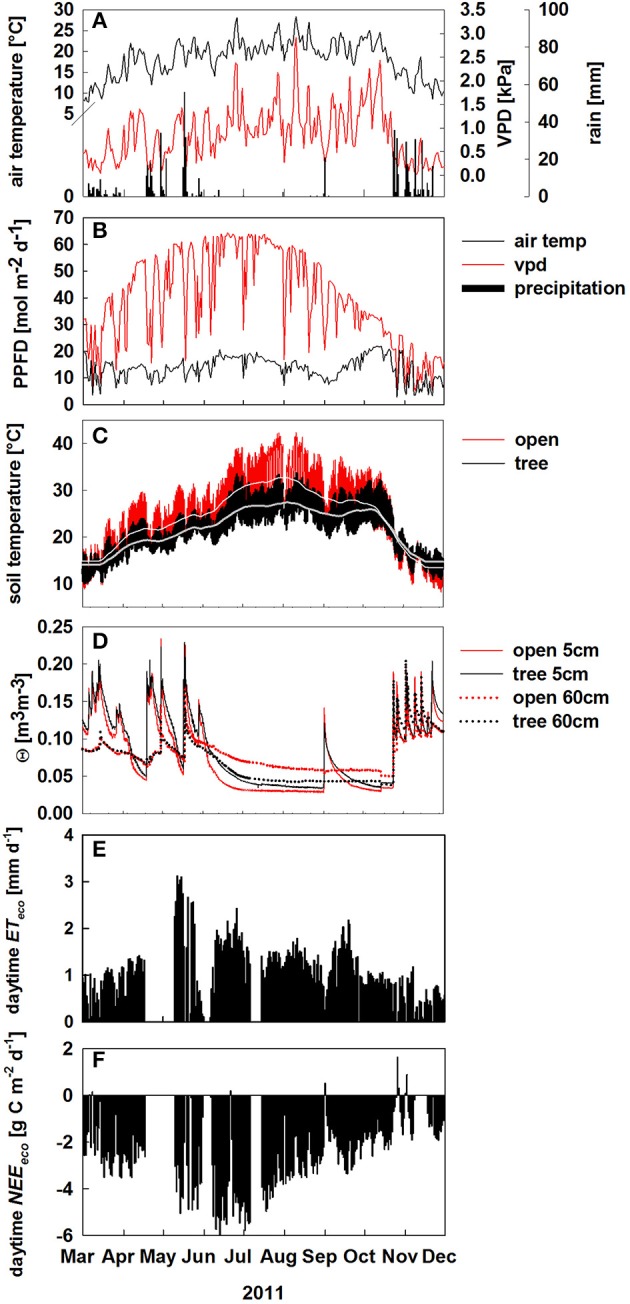
Figure 1.

Environmental conditions from March to December 2011. (A) Daily averages of air temperature (black solid line, °C), vapor pressure deficit (VPD; red solid line, kPa) and daily sums of precipitation (black bars, mm d−1); (B–D) Environmental conditions at the open (red) and tree site (black) of: daily sums of photosynthetic photon flux density (PPFD; mol m−2 d−1), hourly values of soil temperature in 5 cm soil depth (lighter lines denote running averages), soil volumetric water content (Θ, m3 m−3) in 5 and 60 cm soil depth. (E,F) daytime integrated net ecosystem fluxes of: evapotranspiration (ET, mm d−1, black bars), (E) and net CO2 exchange (NEE, g C m−2 d−1), (F) from March to December 2011.
