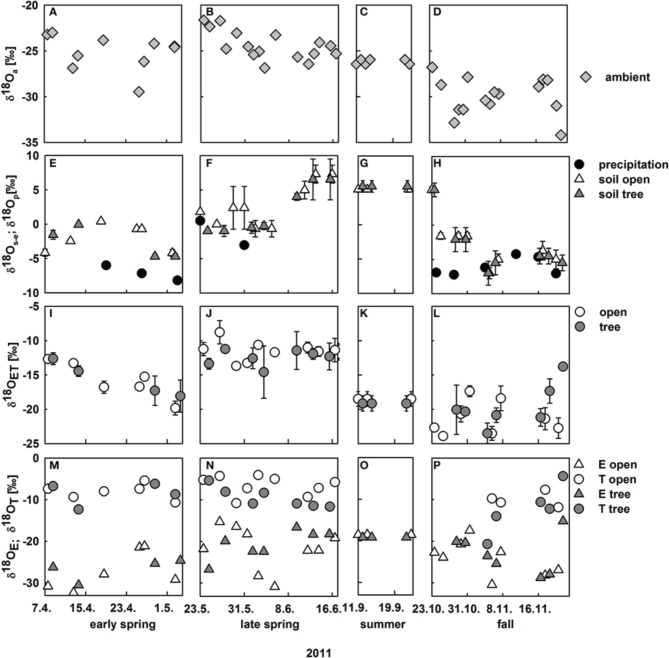
Figure 3.
Development of midday oxygen isotope signatures within the ecosystem from April to November 2011; (A–D) ambient water vapor δ18O at 9 m height; (E–H) δ18O of precipitation (black circles) and δ18O of soil water at the evaporating site on vegetation plots at the open (white triangles) and tree site (gray triangles, mean values ± SD, n = 3); (I–L) measured δ18O of evapotranspiration on the open (white circles) and tree site (gray circles, mean values ± SD, n = 3); (M–P) modeled δ18O of evaporated vapor from vegetation plots on the open (white triangles) and the tree site (gray triangles) and modeled δ18O of herbaceous leaf transpired vapor at the open (white circles) and the tree site (gray circles).

