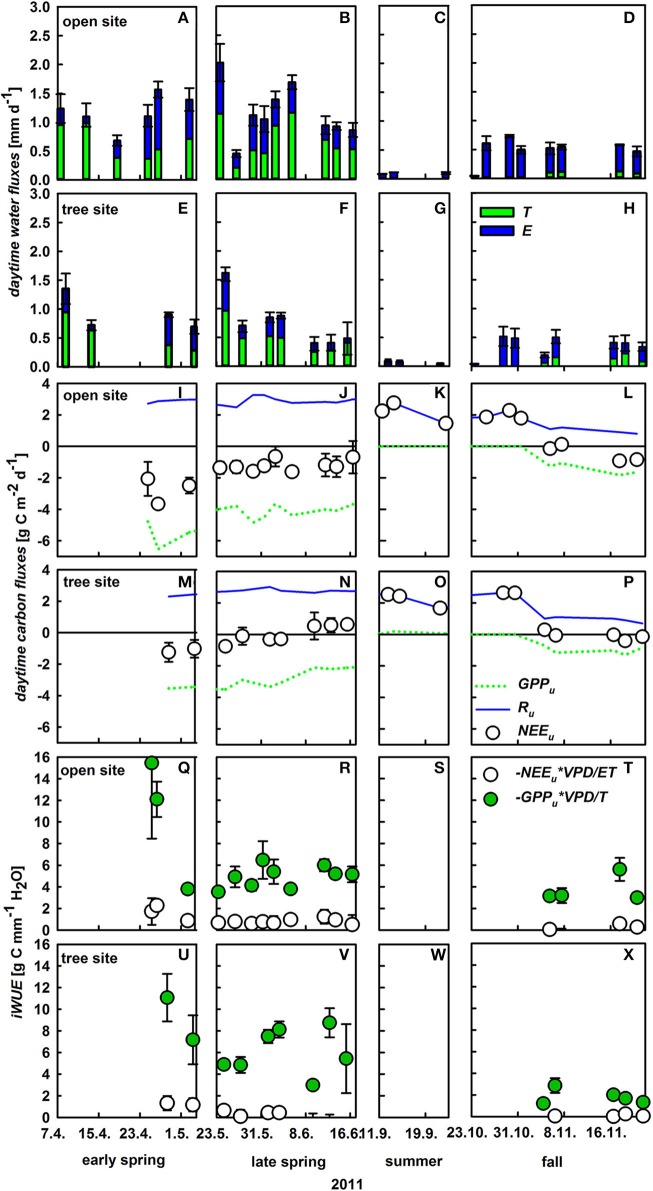
Figure 5.
Daytime integrated understory evapotranspiration (ET, mm d−1, mean values ± SD, n = 3), which is the sum of herbaceous layer transpiration (T, green bars) and soil evaporation (E, blue bars) at the open (A–D) and tree site (E–H); daytime integrated net understory CO2 exchange (NEE, g C m−2 d−1, white circles; mean values ± SE, n = 3), herbaceous gross primary production (GPP, dashed green line, mean values, n = 3) and respiration (R, blue line, mean values, n = 3) on the open (I–L) and tree site (M–P). Inherent water-use efficiency (iWUE) of the whole understory (GPPu × VPD/ET, white circles), and understory vegetation (GPPu × VPD/T, green circles). iWUE was calculated from daytime integrated values of ET, T, and GPPu for the open site (Q–T) and the tree site (U–X).

