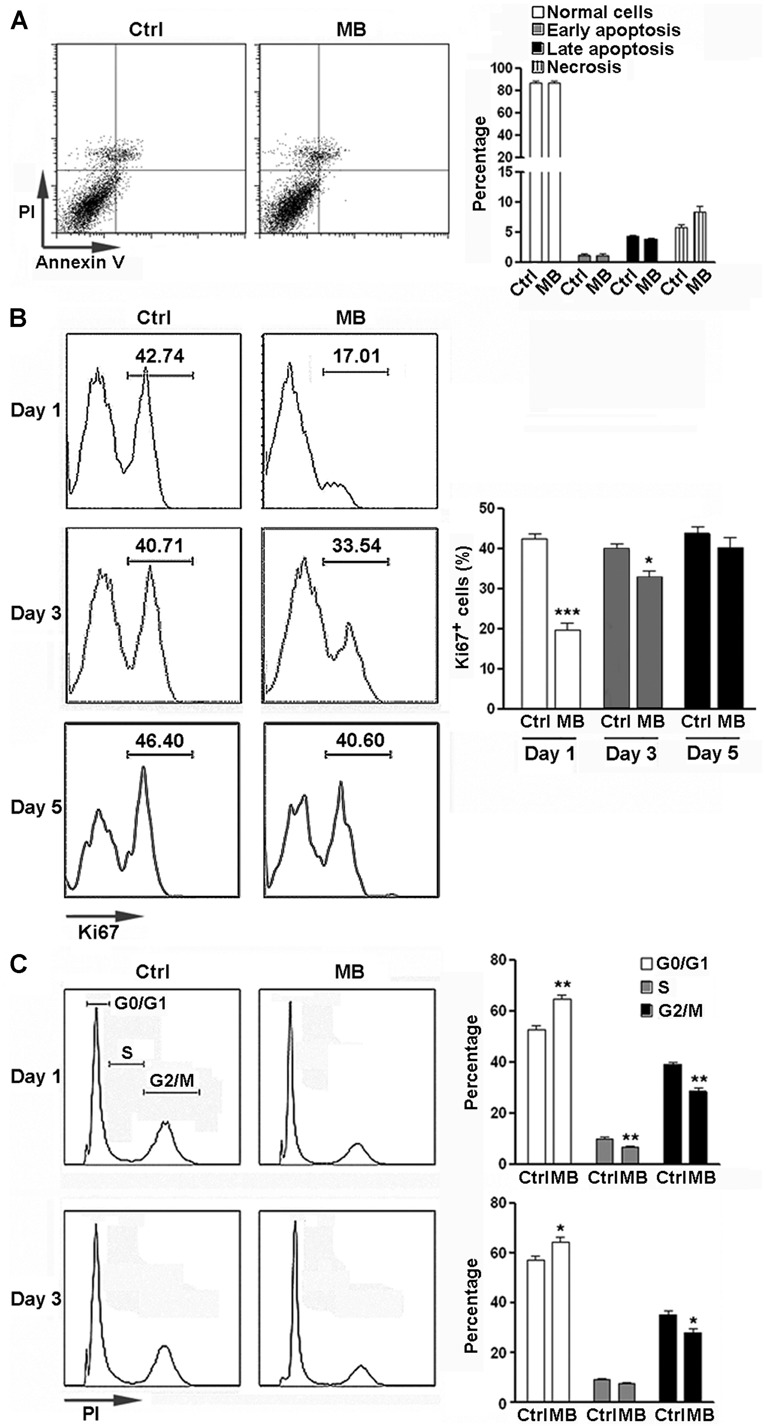
FIGURE 1.

MB inhibits NPC proliferation in vitro. (A) NPC apoptosis after 6 day MB treatment. Left: representative dot plots. Right: statistical analysis. (B) Detection of NPC proliferation by Ki67 staining. Left: representative histograms. Right: statistical analysis. (C) Detection of NPC cell cycle by PI staining at 1 day and 3 days after MB treatment. Left: representative histograms. Right: statistical analysis. N = 6 in each group. Ctrl, control; MB, MB-treated cells. *p < 0.05; **p < 0.01; ***p < 0.001 compared with control group.
