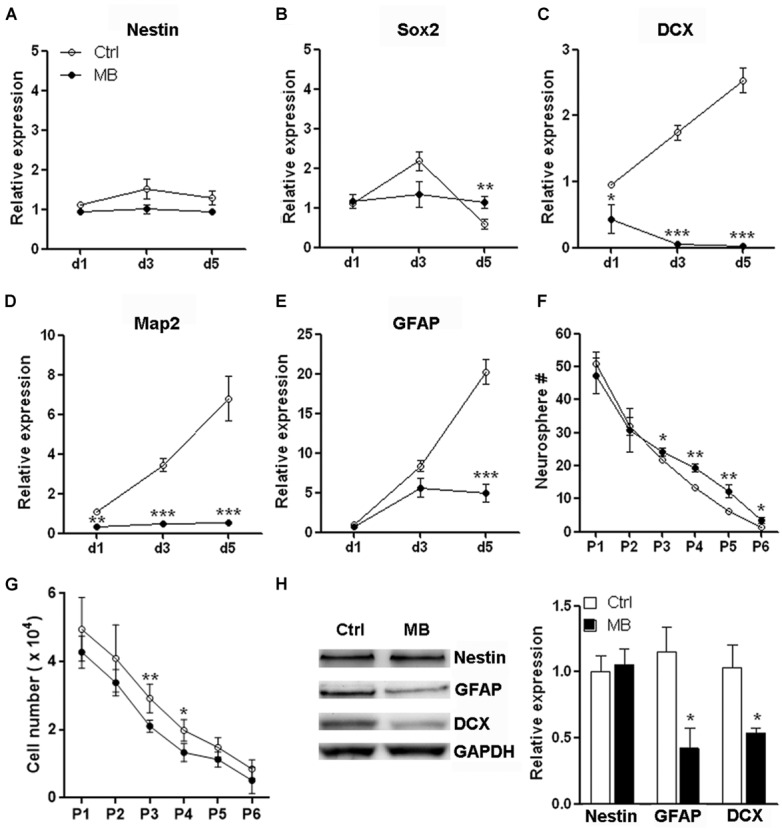
FIGURE 3.

MB maintains neurosphere formation capacity of NPCs. (A–E) Detection of mRNA levels of stem cell, neural and glial markers in passage 1 (P1) NPCs. N = 3 in each group. (F) Serial passage analysis for neurosphere formation. N = 6 in each group. (G) Total cell number counting at the end of each passage. Note that at the beginning of each passage, only 1 × 10⁴ NPCs were seeded. (H) Western blot assay for Nestin, GFAP and DCX expression in P1 NPCs treated with MB for 6 days. Left, representative Western blot image. Right, statistical analysis for expression level of each protein. *p < 0.05; **p < 0.01; ***p < 0.001 compared with control group.
