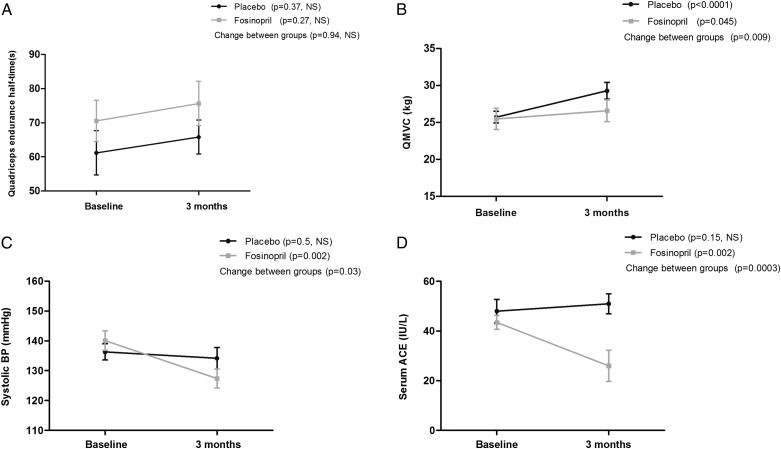
Figure 2 –
A, Quadriceps endurance following 3 mo ACE inhibition vs placebo (data shown as mean with cross bars representing the SEM). B, QMVC following 3 mo ACE inhibition vs placebo (data shown as mean with cross bars representing SEM). C, Systolic BP following 3 mo ACE inhibition vs placebo (data shown as mean with cross bars representing SEM). D, Serum ACE activity following 3 mo ACE inhibition vs placebo (data shown as mean with cross bars representing SEM). ACE = angiotensin-converting enzyme; NS = not significant. See Figure 1 legend for expansion of other abbreviations.

