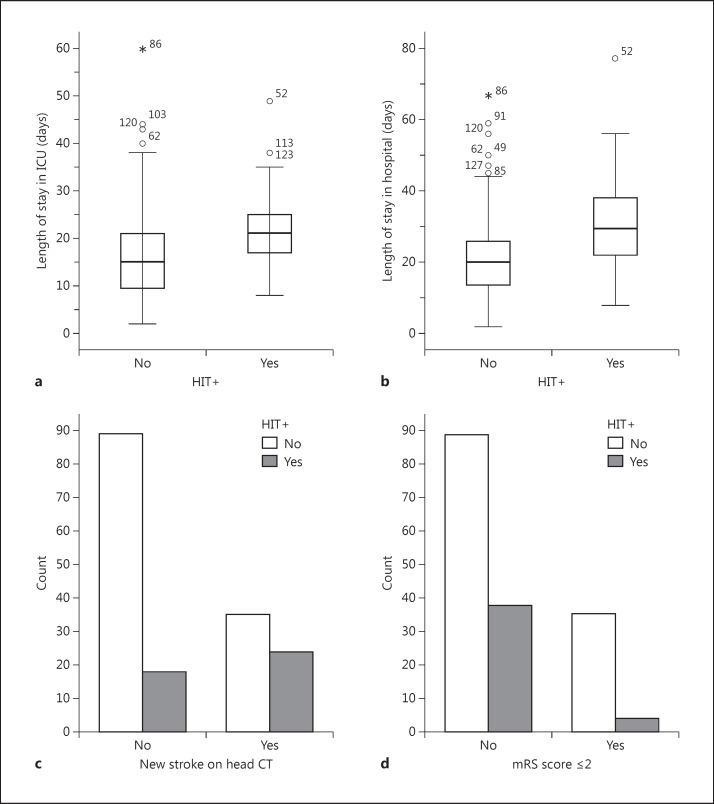
Fig. 3.
HIT outcomes. a, b Box plots of the length of ICU and hospital stay, respectively, for HIT+ and HIT- patients, numbers represent individual case outliers (open circle = 1 standard deviation; asterisk = 2 standard deviations). c, d Total number of HIT+ and HIT- patients with new ischemic lesions or good outcome as measured by an mRS score of ≤2, respectively.

