
Figure 2.
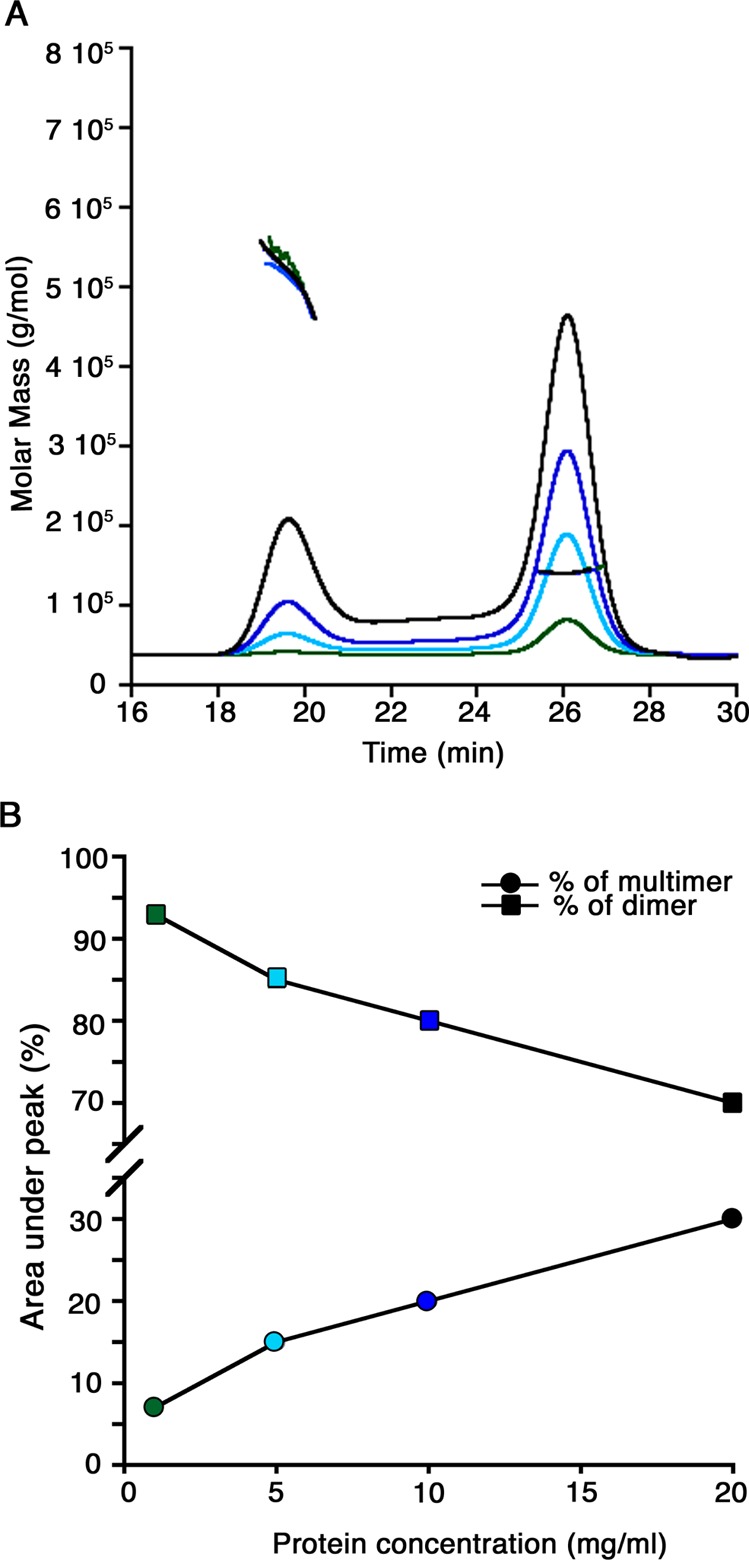
Oligomerization states of M. capsulatus (Bath) MDH in solution. (A) SEC-MALS analysis of MDH at varying protein concentrations. The signals from the refractive index detector are shown as a function of elution time (black for 20 mg/mL, blue for 10 mg/mL, cyan for 5 mg/mL, and green for 1 mg/mL). The thick horizontal lines indicate the calculated molecular masses of the eluting peaks. (B) Comparison of the multimer and dimer peak areas (as percentages) from the SEC-MALS experiments displayed as a line graph. An increased protein concentration results in an increase in multimer percentage concomitant with a decrease in dimer percentage. The colors of the data points correspond to the SEC-MALS traces in panel A.