Figure 3.

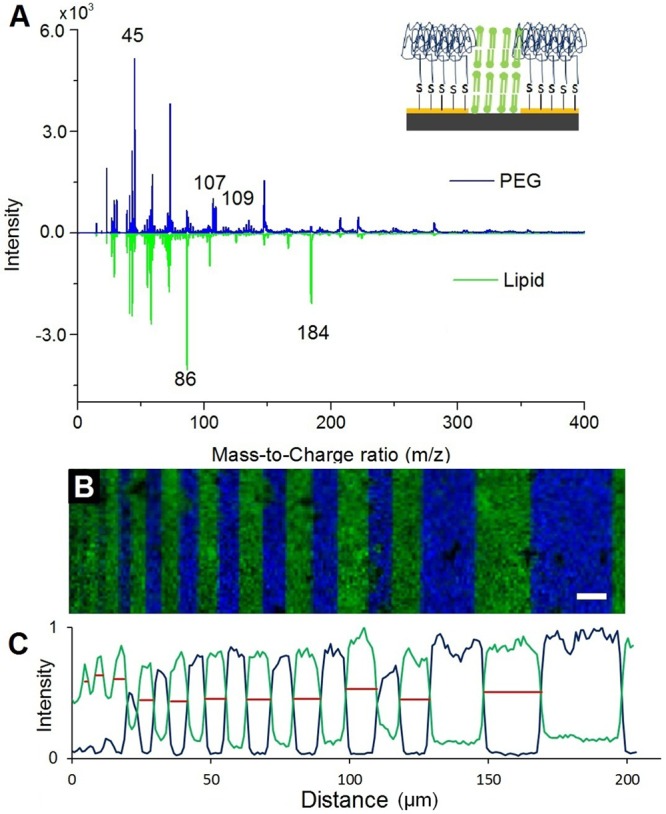
(A) Mass spectra obtained from the two distinct chemical regions of the device; the PEG (blue, top) and lipid (green, bottom) regions. (B) TOF-SIMS image showing the distribution of the PEG polymer fragments at m/z 45, m/z 107, and m/z 109 (blue) and lipid headgroup fragments at m/z 184 and m/z 124.9 (green). The scale bar is 10 μm. (C) The ion intensities for the PEG fragment (m/z 107) and the lipid fragment (m/z 184) were summed along the bar orientation and plotted as a function of lateral space. The fwhm for both the lipid (red) and PEG were measured and reported in Table S1 (see Supporting Information).
