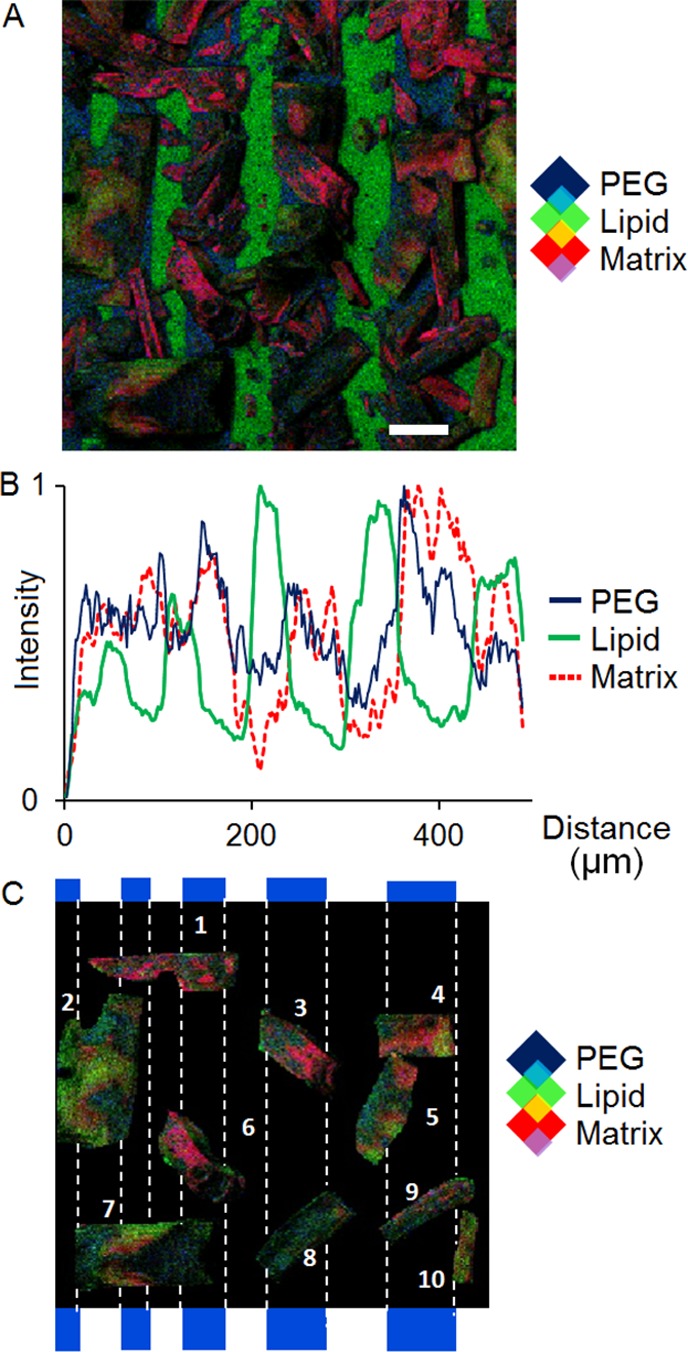
Figure 5.

(A) TOF-SIMS image showing the distribution of matrix (red), PEG (blue), and lipid (green) after solvent-based matrix application (scale bar: 50 μm). (B) The linescan of the three components demonstrates the mixing that occurs as a result of matrix application. (C) Ten individual matrix crystals were isolated from the ion image in order to emphasize the degree of chemical mixing and show the distribution of analyte molecules in matrix crystals.
