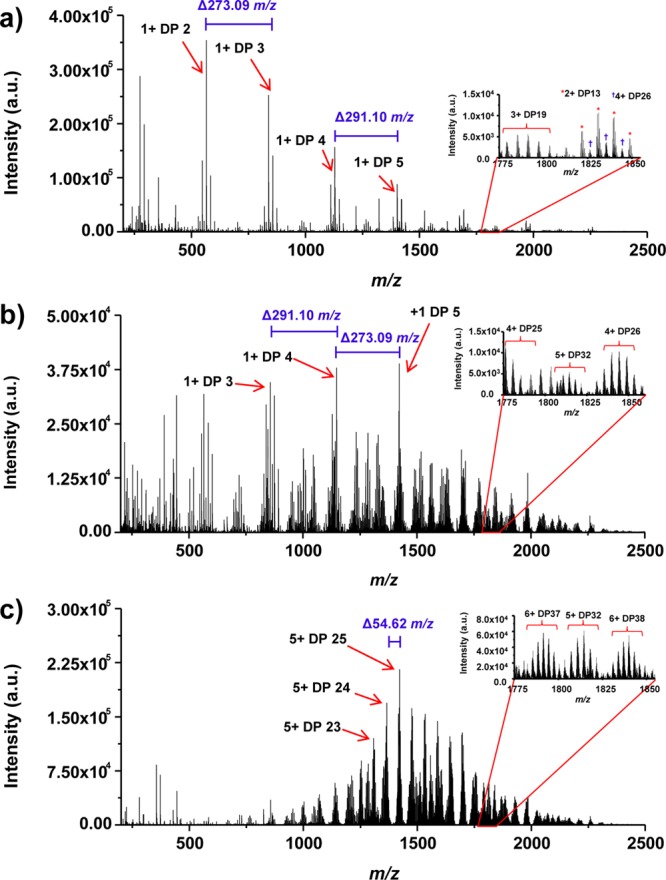
Figure 3.

Averaged mass spectra acquired from elution times 70–80 min from the LC–MS analysis of colominic acid for the conventional ESI interface operated with capillary inlet temperatures of 300 °C (a), and 150 °C (b), and for the SPIN interface (c). The numbers in blue indicate a sialic acid monomer mass difference between polymer units.
