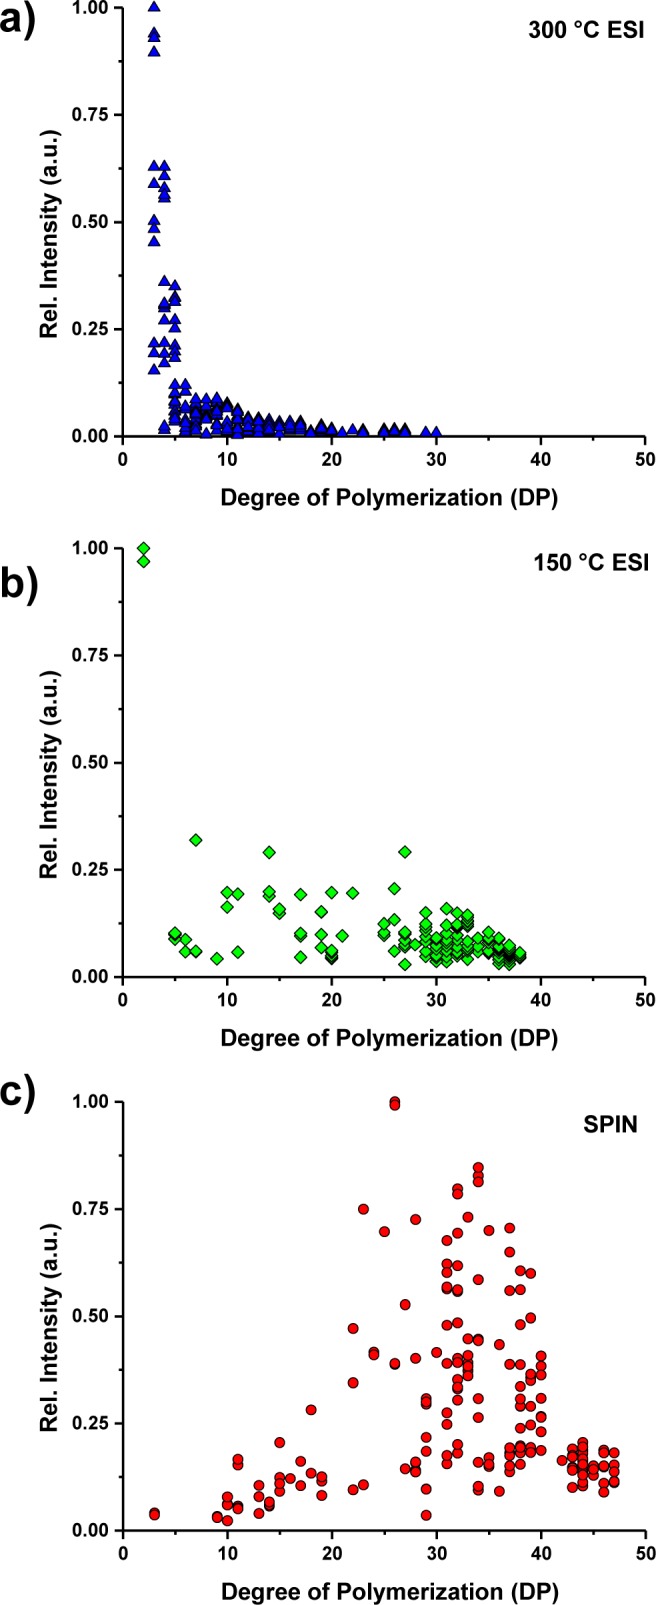
Figure 4.

Polymer structures were extracted from the mass spectra shown in Figure 3 via the GlyQ-IQ software, and a plot of degree of polymerization vs relative intensity (normalized to the most abundant peak) is shown for ESI 300 °C (a), ESI 150 °C (b), and the SPIN interface (c).
