Figure 1.

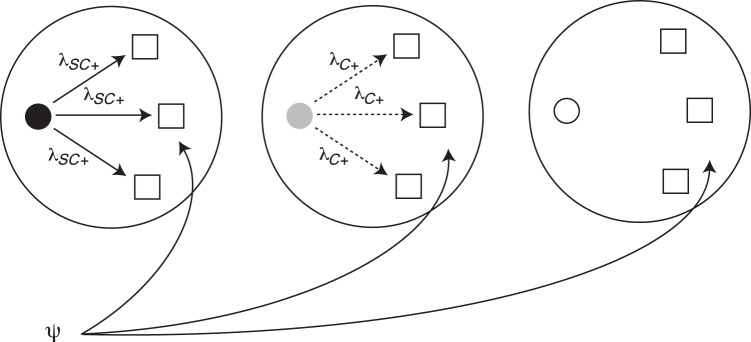
The figure illustrates the different sources of tuberculosis infection in the infection risk model. Smear-positive/culture-positive index cases (black circle) are hypothesized to be the most infectious, followed by smear-negative/culture-positive index cases (gray circle) and then smear-negative/culture-negative index cases (white circle). λSC+ and λC+ indicate the risk of infection for an uninfected household contact (white square) exposed to a smear-positive/culture-positive index case or smear-negative/culture-positive index case, respectively. ψ is the community risk of infection to which all households are subject. The solid arrows indicate a higher hypothesized level of infectiousness than values represented by the dashed arrows. Random intercepts are included in the model at the household and health center level to account for correlated responses within these units.
