
Figure 2.
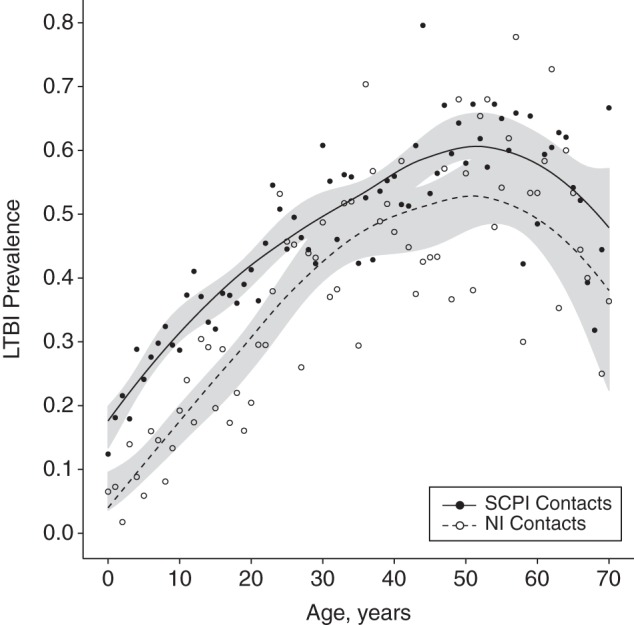
Prevalence of latent tuberculosis infection (LTBI) by age and exposure, Lima, Peru, 2009–2012. The solid dark line shows the smoothed age-specific prevalence of LTBI among persons exposed to a smear-positive/culture-positive index case (SCPI). The dashed line shows the prevalence of LTBI among persons exposed to a smear-negative/culture-negative index case (NI). Filled and empty circles show the raw age-specific prevalence of LTBI for persons exposed to SCPIs and NIs, respectively. Shaded regions indicate 95% confidence intervals for the smoothed prevalence estimates.