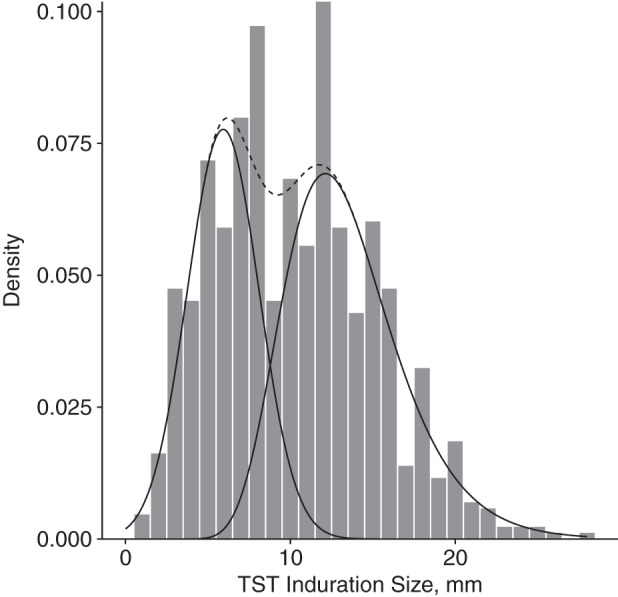
Figure 3.

Tuberculin skin test (TST) responses of persons exposed to a smear-negative/culture-negative index case in the fitted mixture model, Lima, Peru, 2009–2012. Solid lines indicate the fitted densities for the Gaussian mixture component for exposed noninfected persons (mean induration size = 5.56; standard deviation, 1.99; left) and the lognormal mixture component for persons with LTBI (mean induration size = 2.55, standard deviation for the lognormal mixture component, 0.26; right). The dashed line illustrates the sum of the fitted densities from both mixture components.
