
Figure 4.
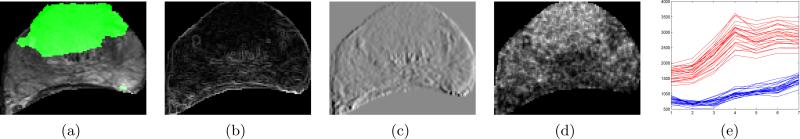
(a) with CaP extent G(C) superposed in green. Feature scenes for in (a) corresponding to (b) first order statistics (standard deviation), (c) Sobel-Kirsch, and (d) second order statistics (contrast inverse moment). (e) Corresponding time-intensity curves for CaP (red) and benign (blue) regions are shown based on DCE MRI data. Note the significant differences in the uptake and wash-out characteristics.