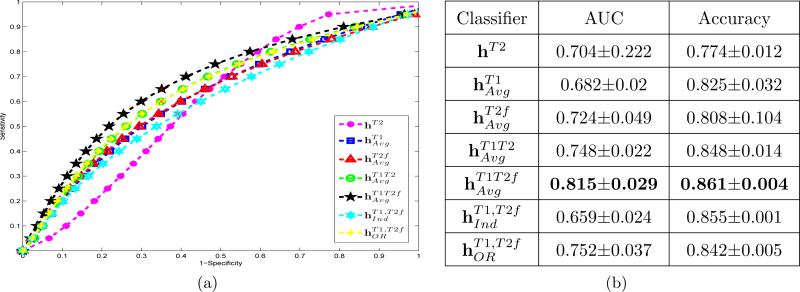
Figure 6.
(a) Average ROC curves across 18 slices and 25 cross validation runs. different colors correspond to different classifiers. The best performance corresponds to the classifier based on integration of structural and functional data , in black. (b) Average and standard deviation of AUC and accuracy values for different classifiers averaged over 18 slices and 25 cross-validation runs.

