
Figure 2.
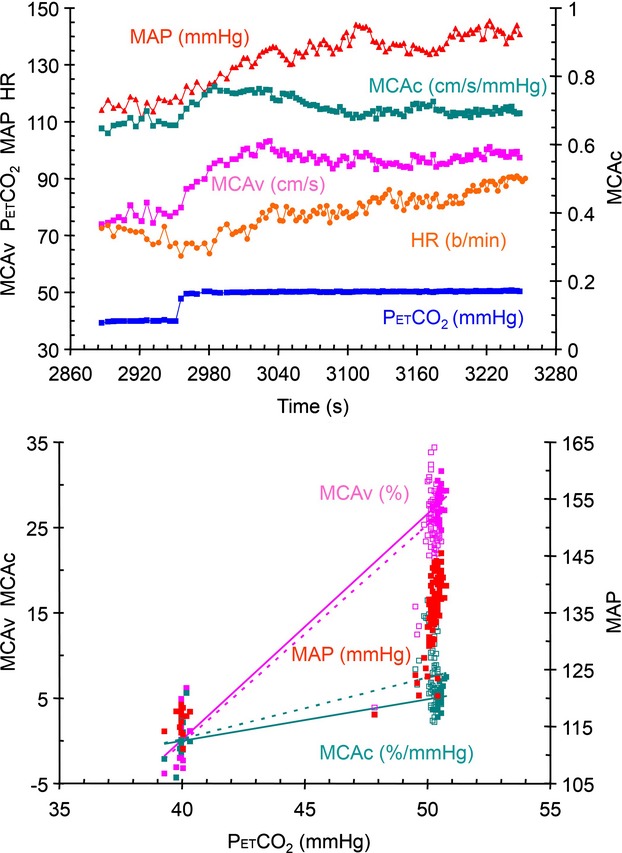
Step test results from subject 4 seated. The top graph shows the breath-by-breath measures of PetCO2, MCAv, MCAc, MAP and HR during the step change in PetCO2. The lower graph shows the relative MCAv and MCAc responses, and the MAP response to PetCO2. The lines in these graphs show the various analyses used to calculate CVR (see text). The SS analysis is indicated by the solid line and filled symbols, and the All analysis is indicated by the dotted line and open symbols. The axes for each variable are as indicated and the units are noted with the color-coded variable labels.