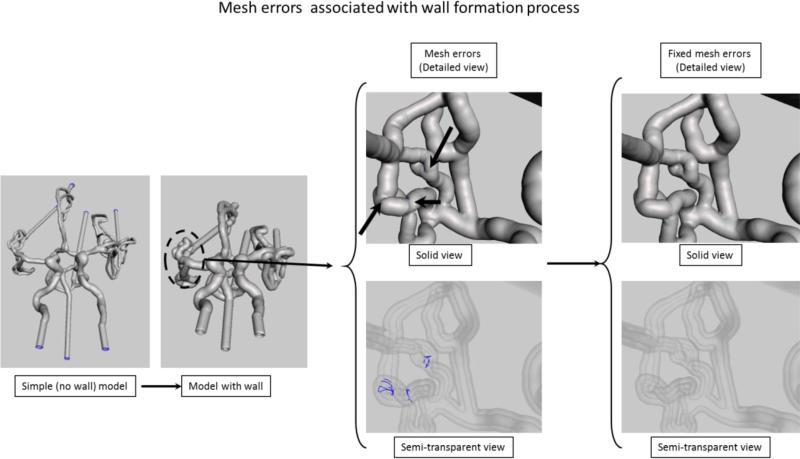
Figure 4.
Extrusion and errors associated with this process. Mesh errors are shown for the area outlined by the dashed circle. In the solid model the errors location is indicated by the black arrows, however in this view the errors are not visible. In the x-ray view of the model the errors due to the mesh self-intersection after extrusion are automatically identified and shown as blue curves.

