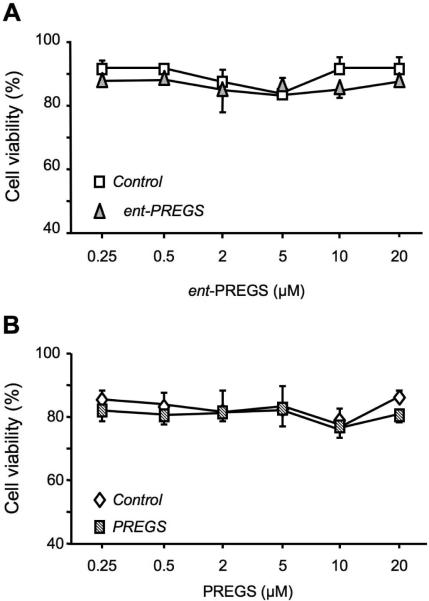
Figure 1.
Dose-response of ent-PREGS and PREGS on B104 cell viability. The percentage of viable cells was quantified by flow cytometry. Two-way ANOVA: F(1,40) = 2.16, p > 0.05 for treatment, F(5,40) = 0.74, p > 0.05 for concentration, F(5,40) = 0.12, p > 0.05 for the treatment × concentration interaction in (A); F(1,20) = 2.64, p > 0.05 for treatment, F(5,20) = 0.66, p > 0.05 for concentration, F(5,20) = 0.50, p > 0.05 for the interaction in (B).

