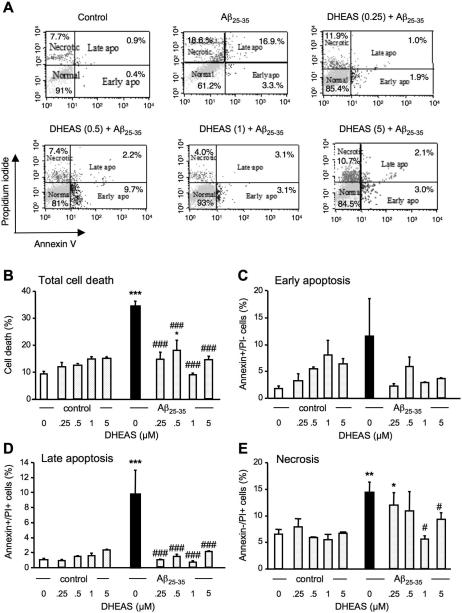
Figure 8.
Cytometric analysis of the prevention by DHEAS (0.25-5 μM) of Aβ25-35-induced B104 cell death: (A) representative Annexin-V-Alexa 488/propidium iodide (PI) double stainings of B104 cells treated with Aβ25-35 peptide alone and cells pre-treated with DHEAS followed by Aβ25-35 peptide. The percentages of cells analyzed by flow cytometry in each quadrant under each condition are indicated: lower left, Alexa 488−/PI−, normal intact cells; lower right, Alexa 488+/PI−, early apoptototic cells; upper left, Alexa 488−/PI+, necrotic cells; and upper right, Alexa 488+/PI+, late apoptotic cells. Graphs show the quantifications of the percentages of dead cells (B), early apoptotic cells (C), late apoptotic cells (D), and necrotic cells (E). Oneway ANOVA: F(9,23) = 6.36, p < 0.001 in (B); F(9,23) = 1.28, p > 0.05 in (C); F(9,23) = 4.01, p < 0.01 in (D); F(9,23) = 2.62, p < 0.05 in (E). * p < 0.05, ** p < 0.01, *** p < 0.001 vs. control cells; # p < 0.05, ## p < 0.01, ### p < 0.001 vs. Aβ25-35-treated cells; Fisher's PLSD test.

