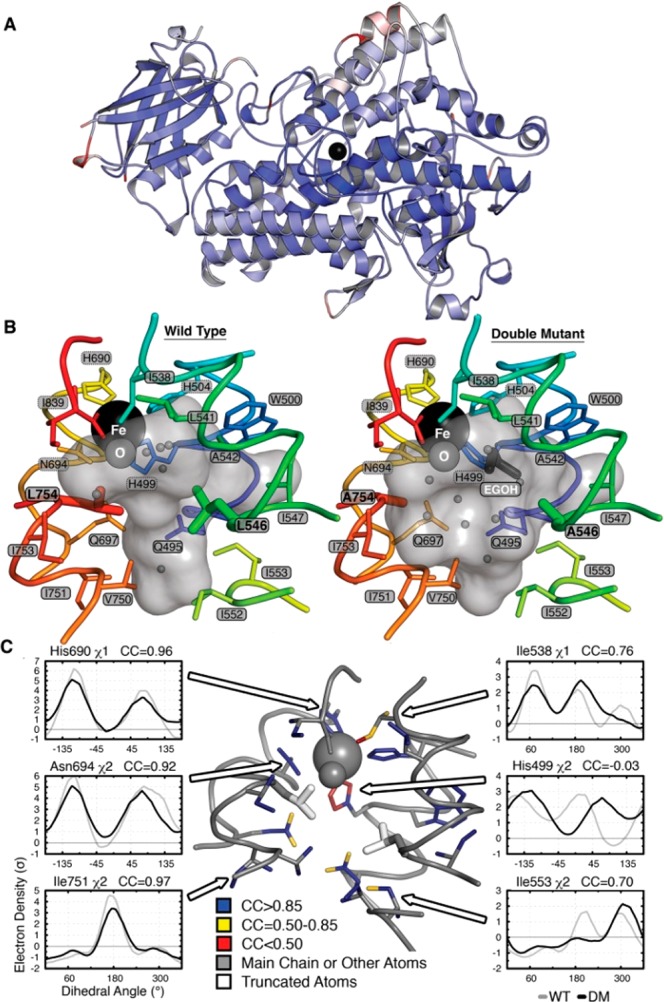
Figure 1.

Crystal structure of DM SLO. (A) Superposition of the ribbon diagrams of WT and DM SLO with the Fe (black sphere) in the center. Colors represent Cα-RMS displacements from 0 Å (blue) to 0.5 Å (white) to 1 Å (red). (B) Solvent-accessible surface of the active-site cavity in the WT and DM SLO structures. The mutations make the cavity larger, allowing binding of ethylene glycol (dark gray sticks) and altering the water (small gray spheres) distribution. (C) Side-chain populations are similar in the DM and WT enzymes. Side chains lining the cavity are colored according to the correlation coefficient (CC) of the electron density (σ) sampled around each dihedral angle using the program Ringer. CC values above 0.85 (blue) reflect nearly identical conformational distributions, while CC values of 0.85–0.5 (yellow) or below 0.5 (red) reflect increasingly larger population shift. Representative plots of electron density vs dihedral angle show similar distributions (left) and the three largest differences (right).
