Figure 4.

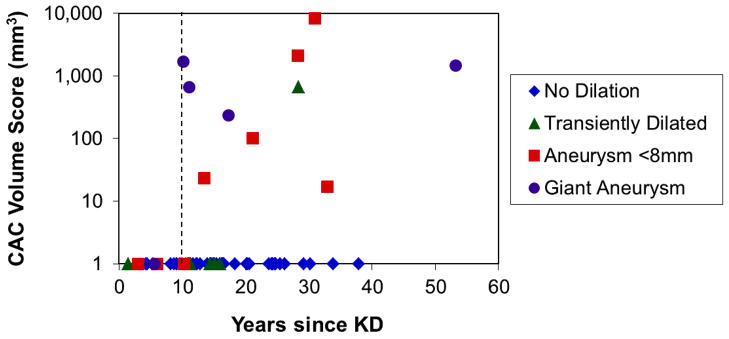
CT calcium volume scores (on a logarithmic scale) as a function of the time since the patients’ acute Kawasaki Disease (KD), coded by coronary artery status. The vertical dotted line indicates 10 years post-onset of KD.

CT calcium volume scores (on a logarithmic scale) as a function of the time since the patients’ acute Kawasaki Disease (KD), coded by coronary artery status. The vertical dotted line indicates 10 years post-onset of KD.