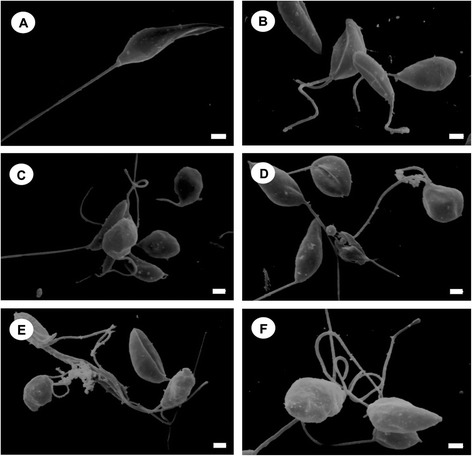
Figure 2.

Scanning electron microscopy of Leishmania amazonensis promastigotes. The figure shows control promastigotes (A) and promastigotes treated with concentrations that corresponded to the IC50 (B-D) and IC90 (E,F) of BZTS. (A) The protozoan presented typical characteristics, with an elongated shape and free flagellum. (B-F) BZTS induced alterations in the shape and size of the protozoan. Scale bar = 1 μm.
