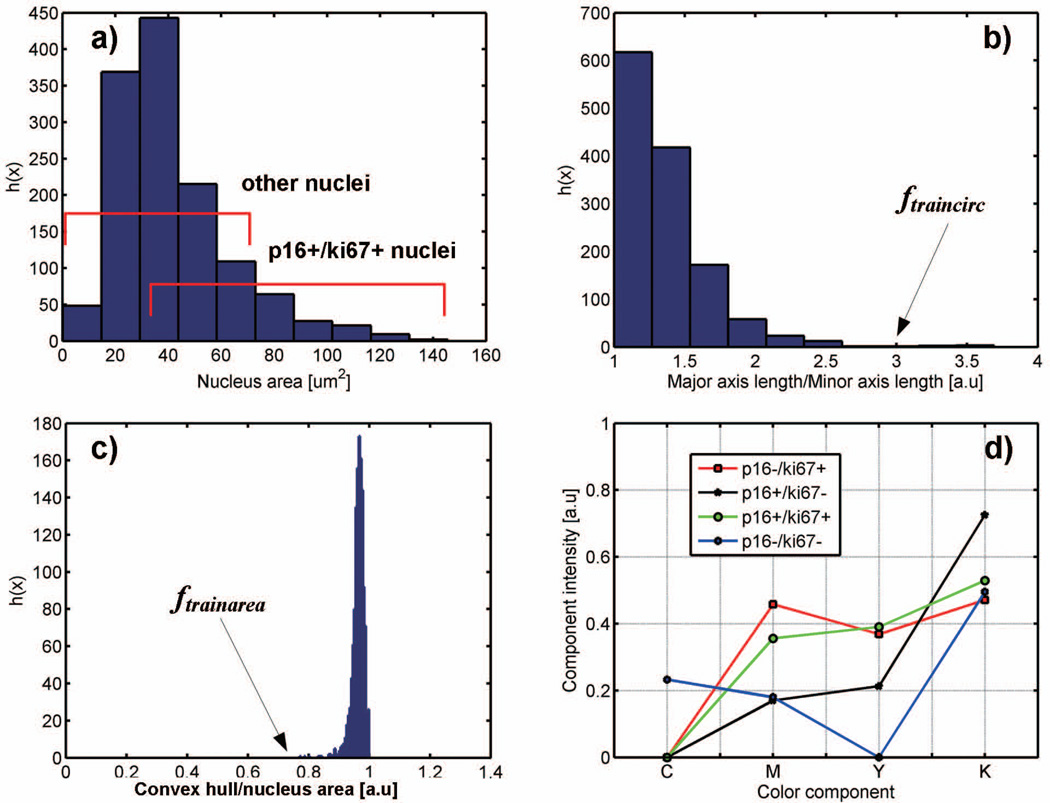
Figure 1.
Histograms of shape features in manually delineated nuclei: a) nuclear area, b) major axis length to minor axis length ratio and the ftraincirc cutoff, c) convex hull to nuclear area ratio and the ftrainarea cutoff, d) averaged CMYK intensities of nuclear immunoreactivity in 4 IHC staining patterns.

