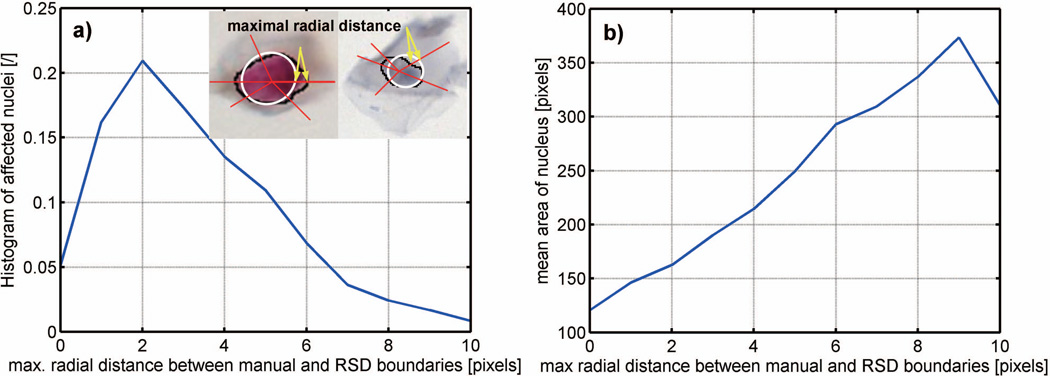
Figure 4.
Distribution of maximal radial distance error measured between RSD-based and pathologist outlines: (a) histogram of affected nuclei, and (b) maximal radial error as a function of mean nuclear area. The two nuclei in the insert depict the error between the RSD-based (white line) and pathologist (black line) outlines. Yellow arrows show where maximal distances occurred.

