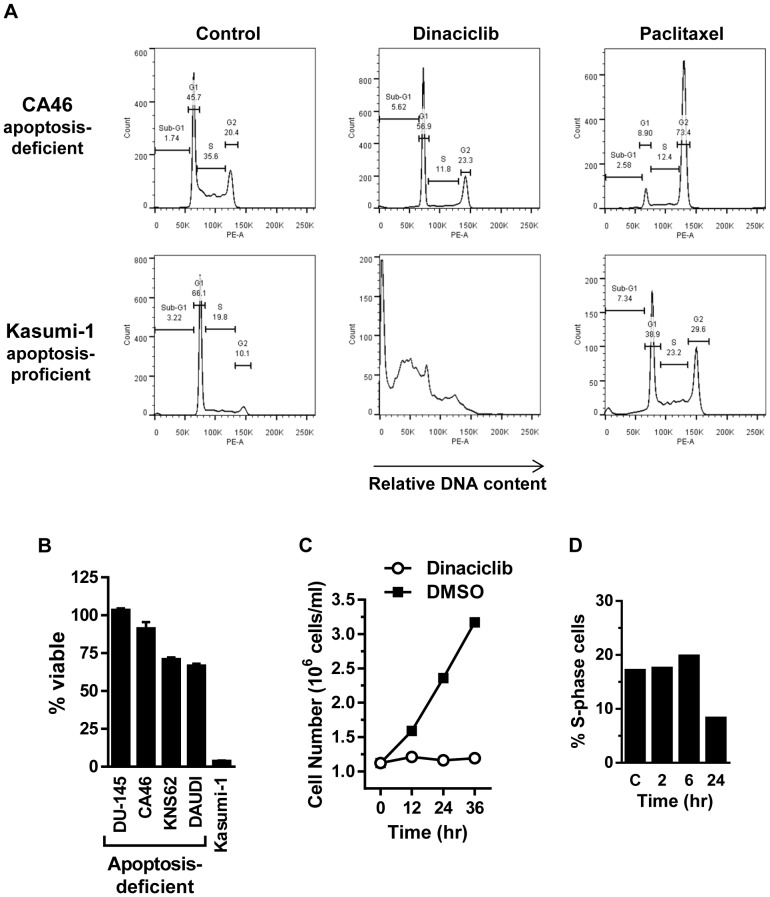
Figure 4. Cell cycle analysis of dinaciclib in apoptotic-proficient and apoptotic-deficient cell lines.
(A) Apoptotic-deficient CA46 cells and apoptotic-proficient Kasumi-1 cells were treated for 24 hr with dinaciclib (100 nM) or mitotic inhibitor paclitaxel (3 µM). DNA content was analyzed by propidium iodide staining and flow cytometry to determine cell cycle effects. Bars used to calculate the percent of cells in sub-G1 (apoptotic) or G1, S, G2 cell cycle phases are shown. (B) Percent cell viability remaining in apoptotic-deficient (DU-145, CA46, KNS62, DAUDI) and apoptotic-proficient (Kasumi-1) cells after 24 hr dinaciclib (100 nM) treatment. (C) Cell proliferation of apoptotic-deficient CA46 cells during 36 hr dinaciclib (100 nM) (open circles) or DMSO-control (filled squares) treatment. (D) Apoptotic-deficient CA46 cell line treated 2 and 6 hr with dinaciclib (100 nM) followed by drug wash-out and 24 hr recovery. DMSO-treated control cells and 24 hr continuous dinaciclib (100 nM) treated cells are represented by C and 24 hr, respectively. DNA content was analyzed by propidium iodide staining and flow cytometry and the percent S-phase cell population is shown. The failure of the S-phase peak to decrease after a transient 2 and 6 hr dinaciclib treatment indicates rapid recovery of CDK1 and 2 functions.

