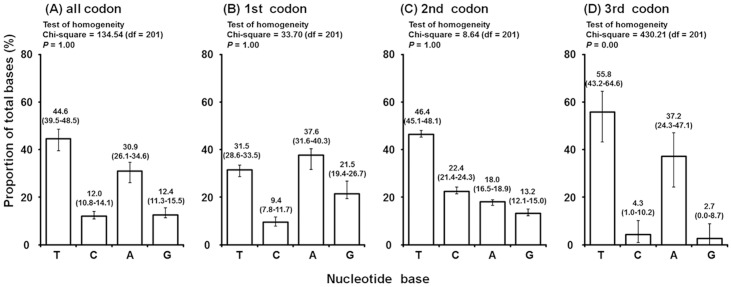
Figure 1. Base compositions of the codons of the mitochondrial COI gene.
(A) All codon positions, (B) 1st codon position, (C) 2nd codon position, (D) 3rd codon position, averaged over all 68 mite strains used in this study. Error bars depict range. Results of the homogeneity test are given for each codon position.

