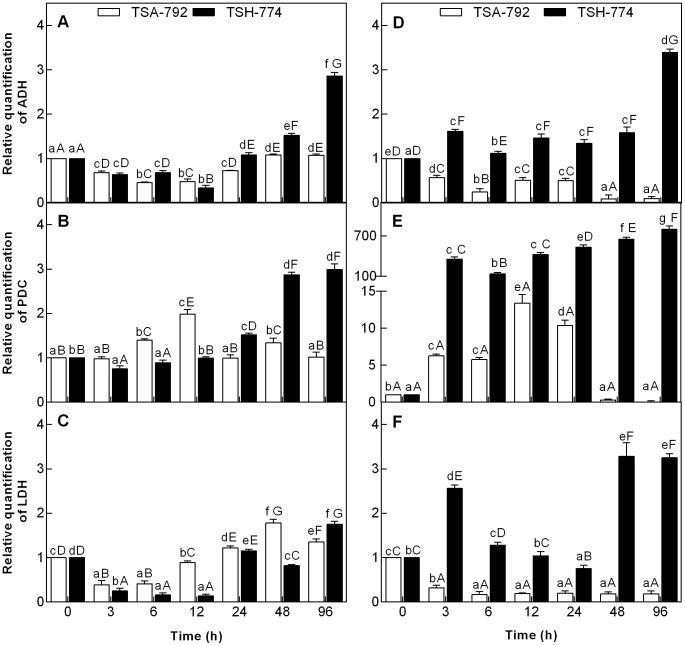
Figure 1. Relative quantity of transcripts encoded by the gene enzymes ADH (A and D), PDC (B and E) and LDH (C and F) quantified by qPCR and normalized by β-tubulin transcripts.
The expressed values are relative to the responses of control leaves (A, B and C) and roots (D, E and F) as compared with those of flooded plants in two clonal genotypes of Theobroma cacao, (TSA-792 and 774-TSH). The columns represent the mean values ± SE (standard error) of six biological replicates. Uppercase letters compare differences between genotypes and lowercase letters compare differences within genotypes. Mean comparisons were using a Tukey test (P<0.05).

