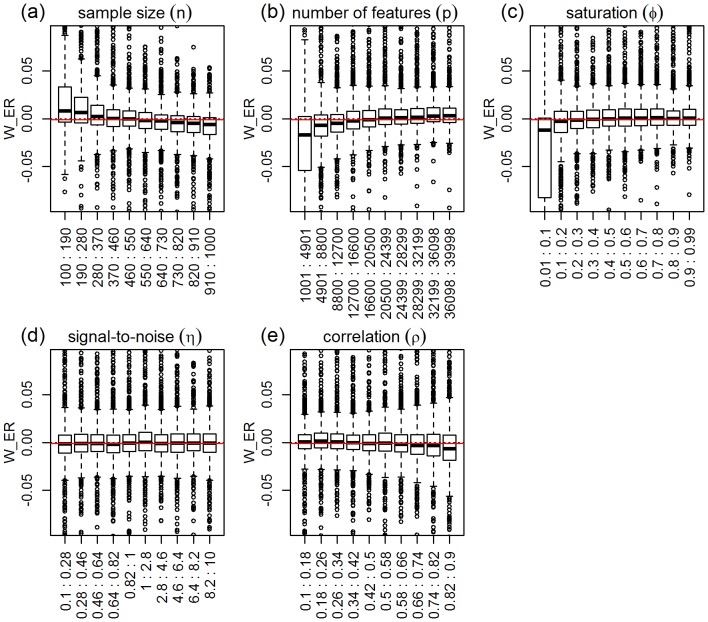
Figure 11. Distributions of the relative performance response in the ridge-regression vs elastic-net comparison, across 10 equally spaced bins of the parameters ranges.
The x-axis show the parameter ranges comprised by each of the 10 bins. The y-axis shows the relative performance response  . The red horizontal line represents the median of the response distribution. The dotted line is set at zero.

