
Fig. 1.
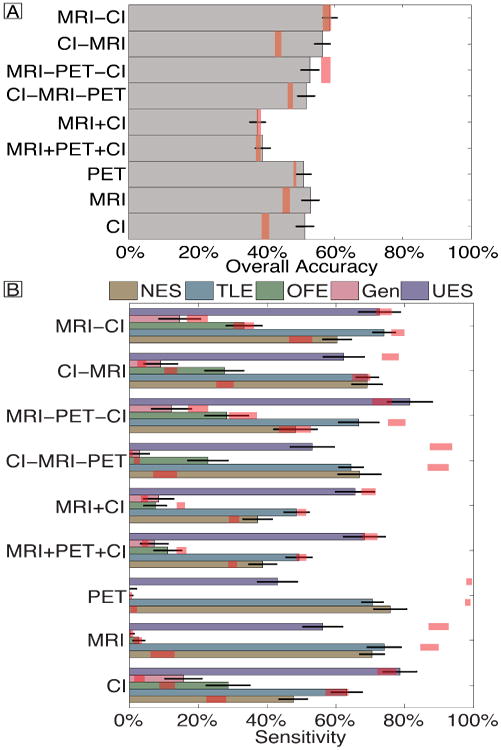
Overall accuracy (A) and per-class sensitivity (B) of each classifier. Error bars reflect binomial theoretical standard error bars, with multiple imputation. Red shading reflects the 95% quantile bounds from permutation tests. Vector concatenation and conditional dependence are indicated by + and -, respectively. For conditional dependence, the order of modalities is read from left to right. Abbreviations: Clinical information (CI).