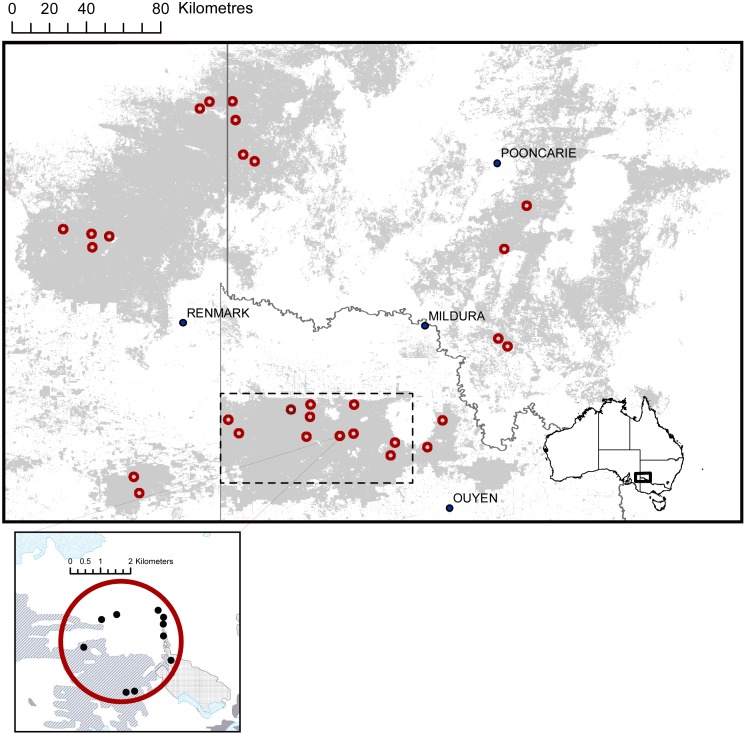
Figure 1. Map of study area showing all landscapes (circles) considered in this study (grey shading indicates mallee vegetation; majority of white areas indicates agricultural land used for grazing and cereal crops).
The dashed box shows the spatial extent of the site-scale study. An inset shows an example of a study landscape including the position of 10 sites within where site-scale data were collected. Within the inset, different hatching represents different fire ages.

